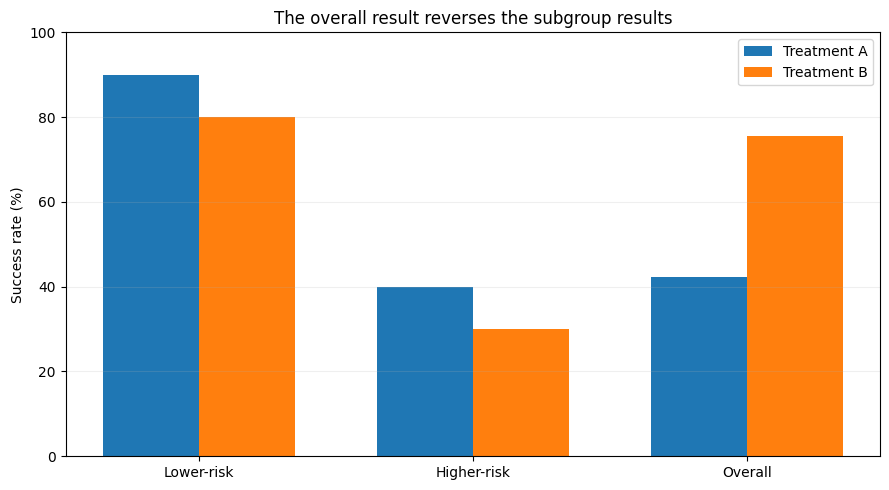
One of my favorite parts of data analysis and visualization is the storytelling. I understand that we often rush to conclusions because the next steps — whether that's making business decisions, feeding the data to an ML model, or convincing shareholders the company is doing great — matter. However, I love trying to figure out the data’s story, for the sake of the story… or, better yet, to experiment with how we can tell it.
Okay, let’s step back and imagine you are comparing two new medical treatments, A and B (I am not creative with names!). An initial assessment shows that treatment A has a higher success rate than Treatment B. So, you look at the numbers, check the calculations, and conclude that Treatment A is better. Seems reasonable, right?
You decide to take your friend’s opinion on the data; they point out that Treatment B has a higher overall success rate. So, you check again.…