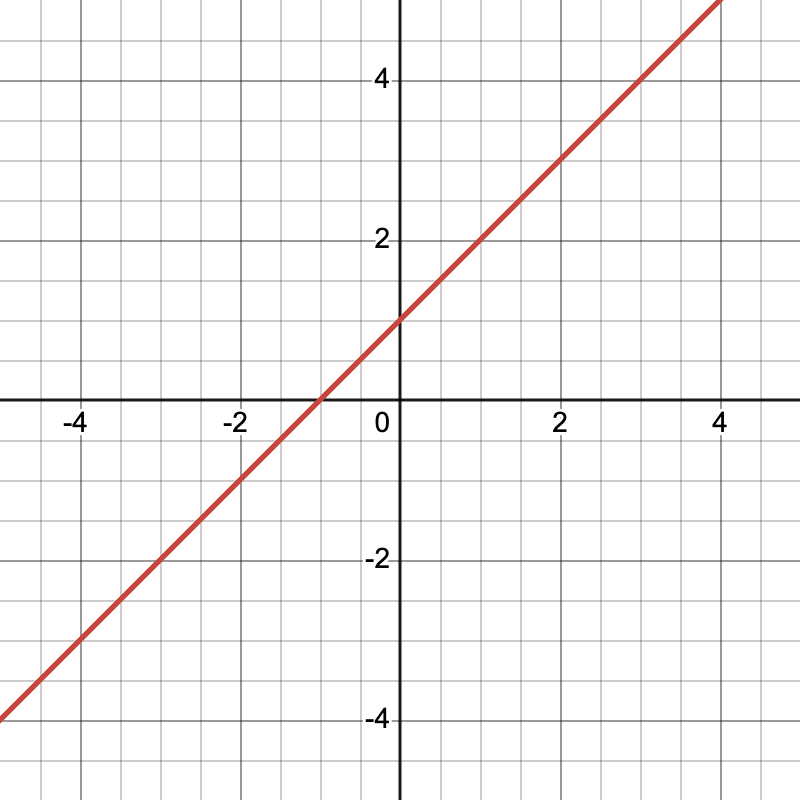
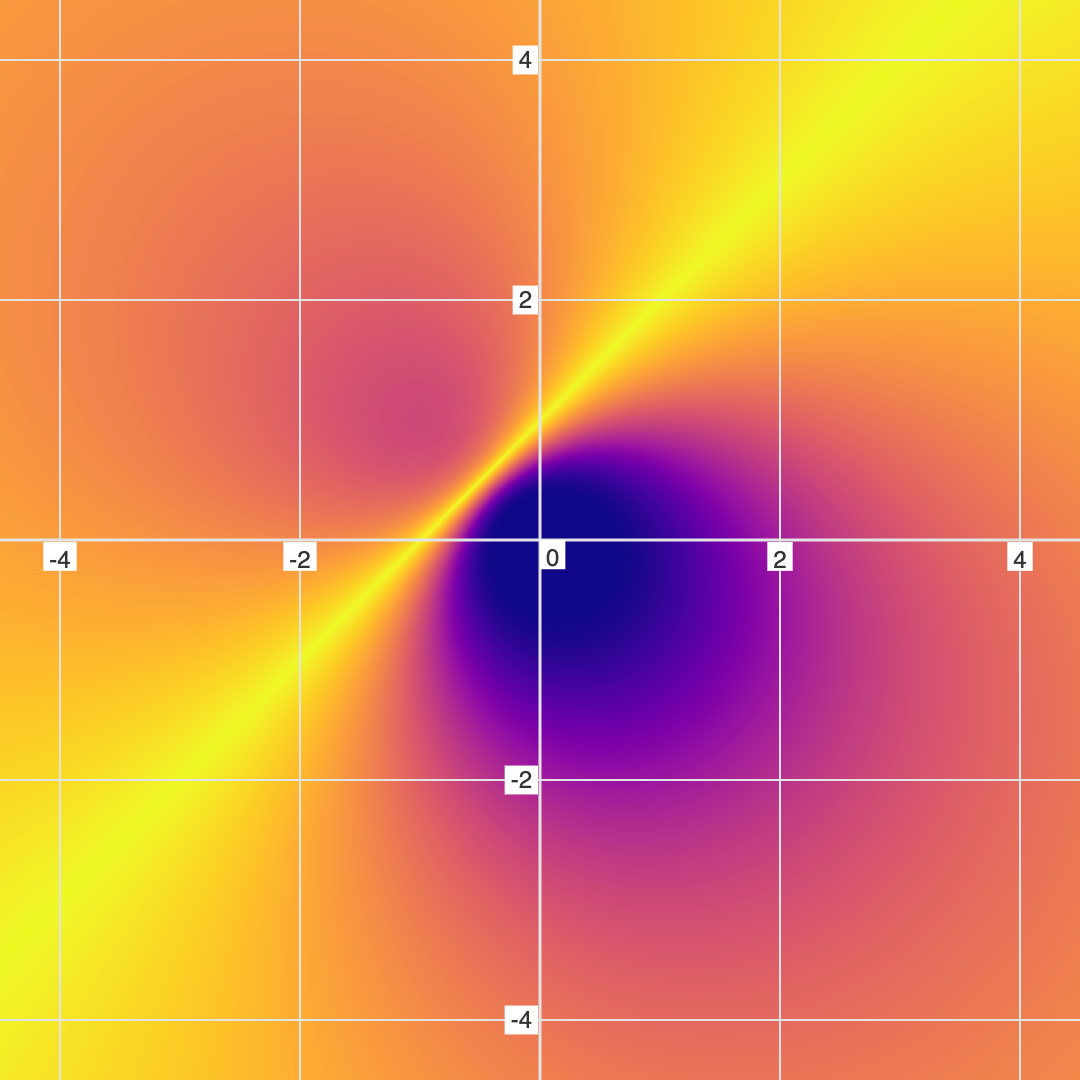
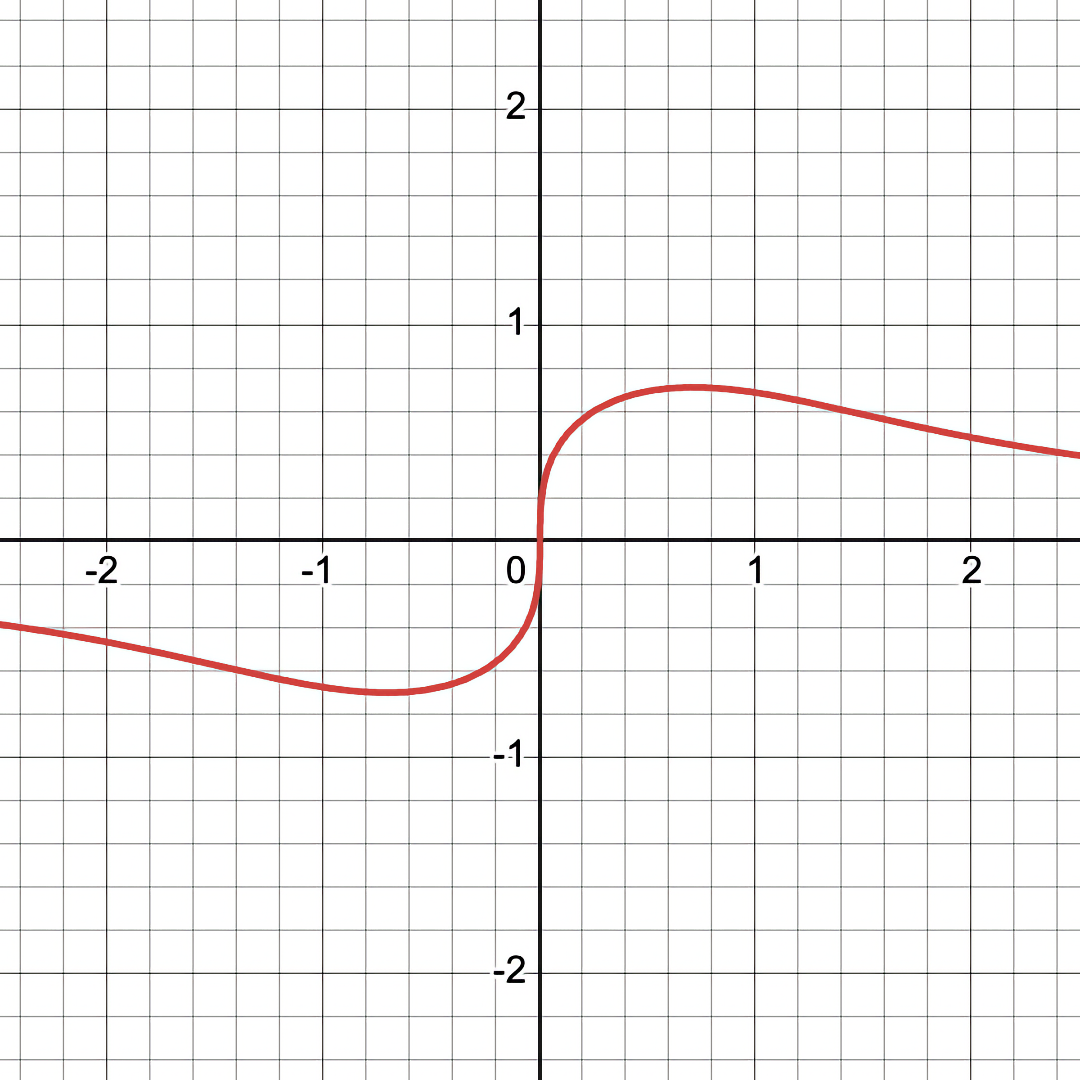
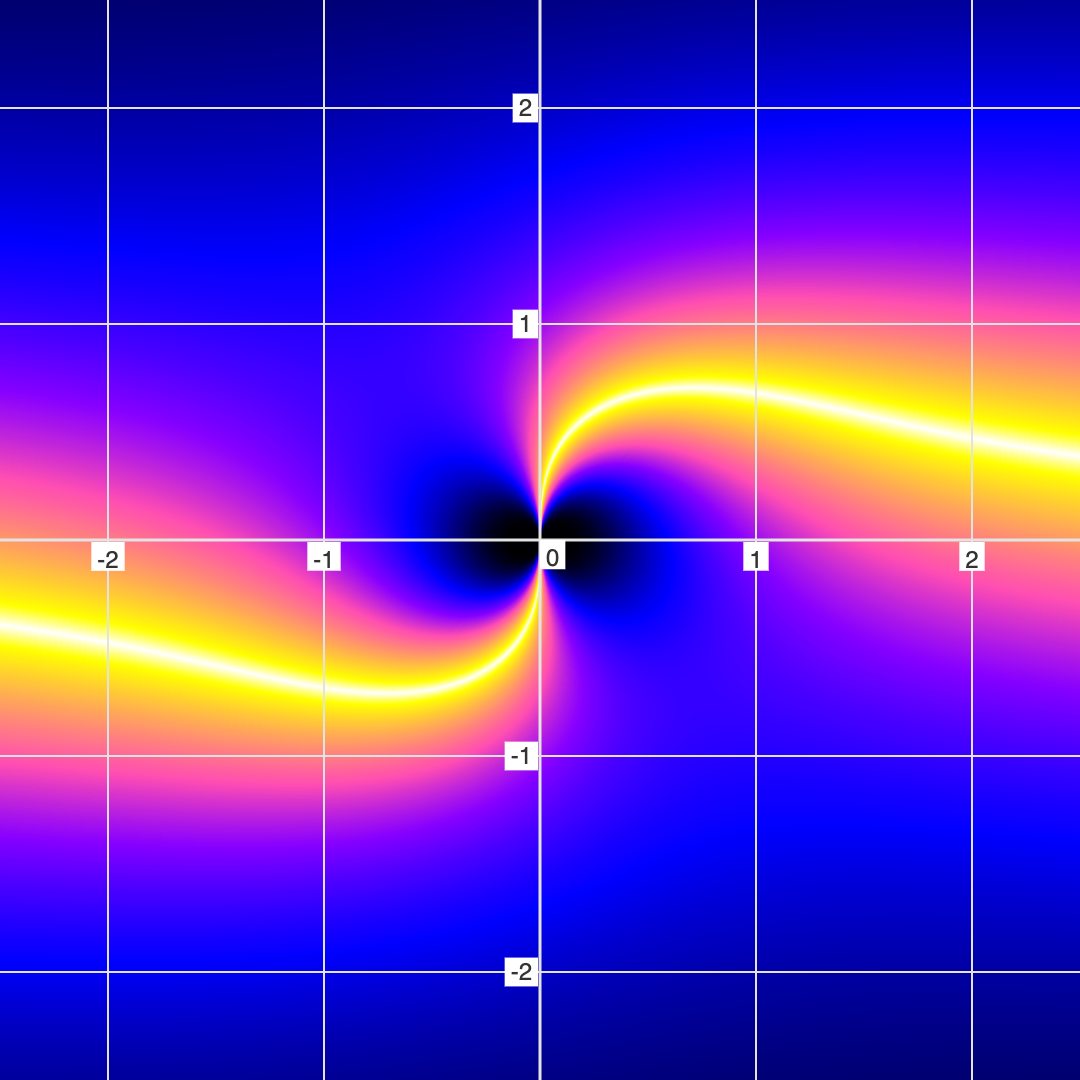
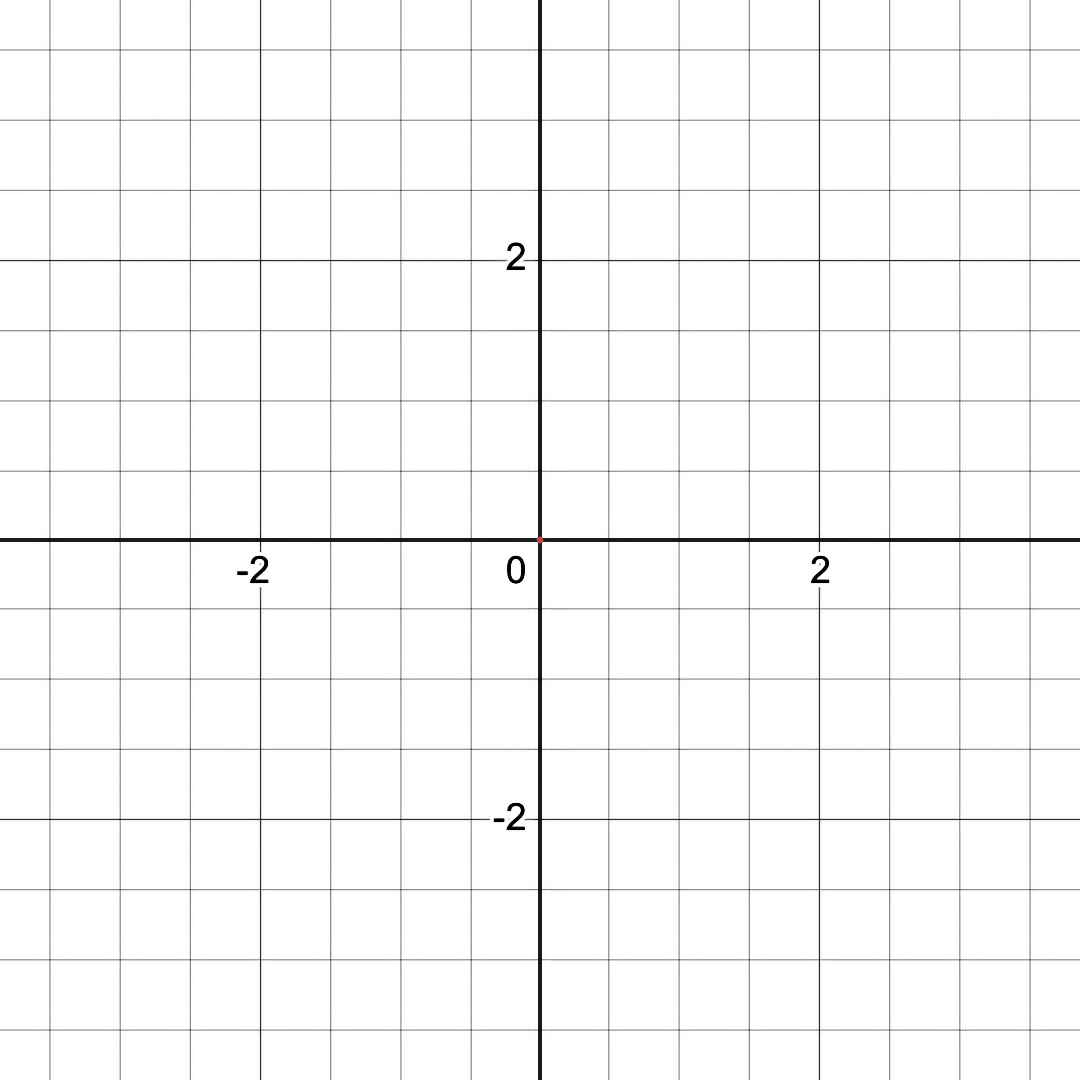
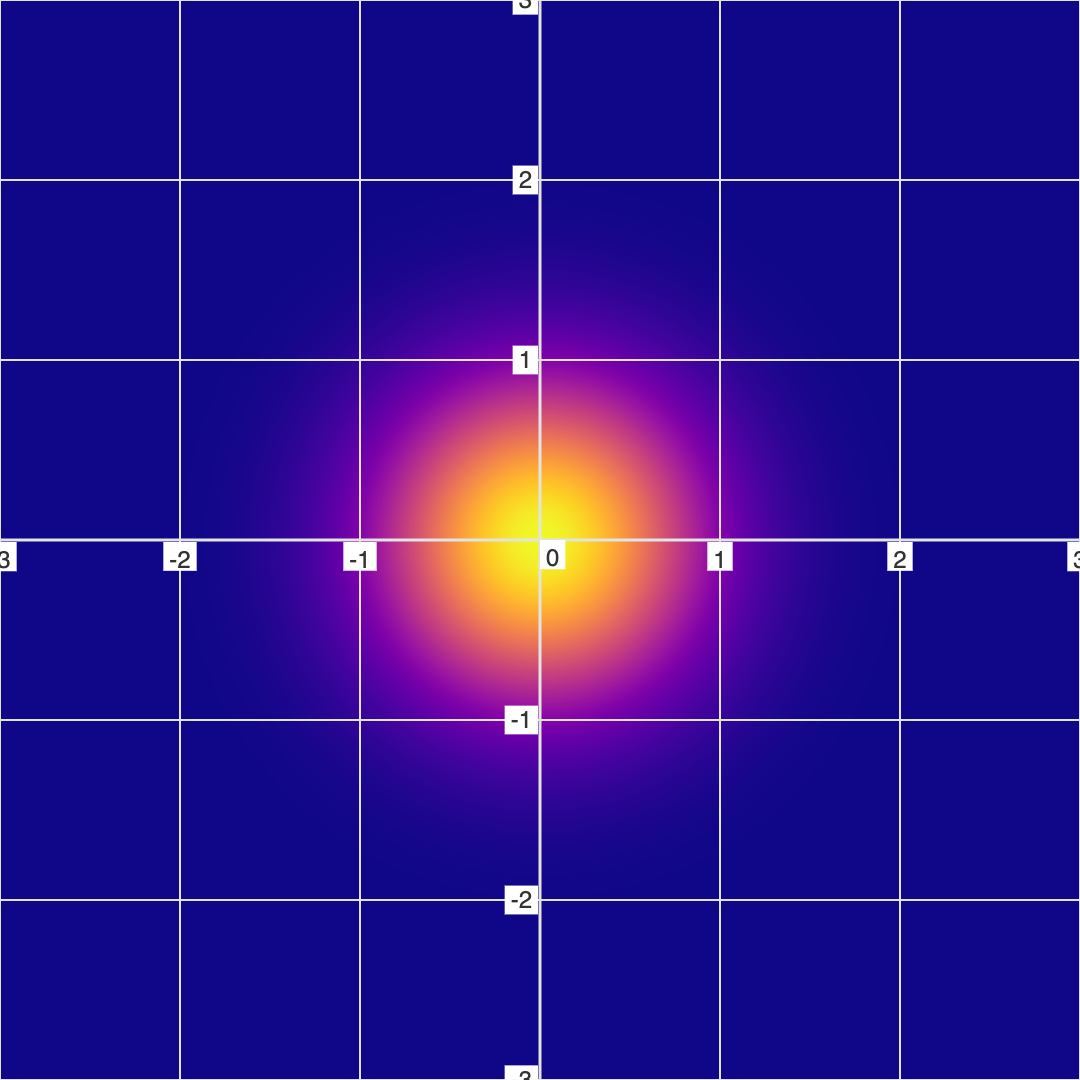
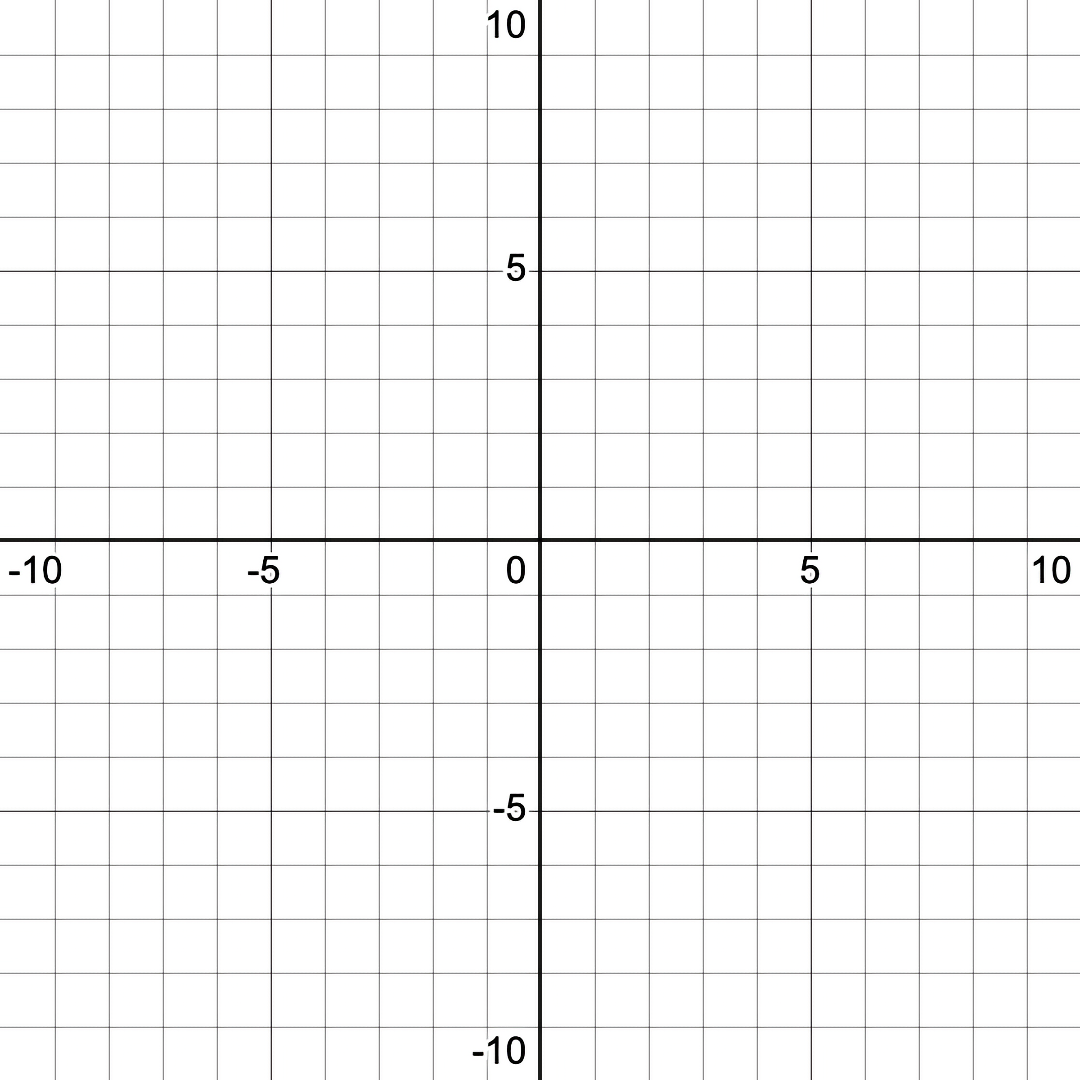
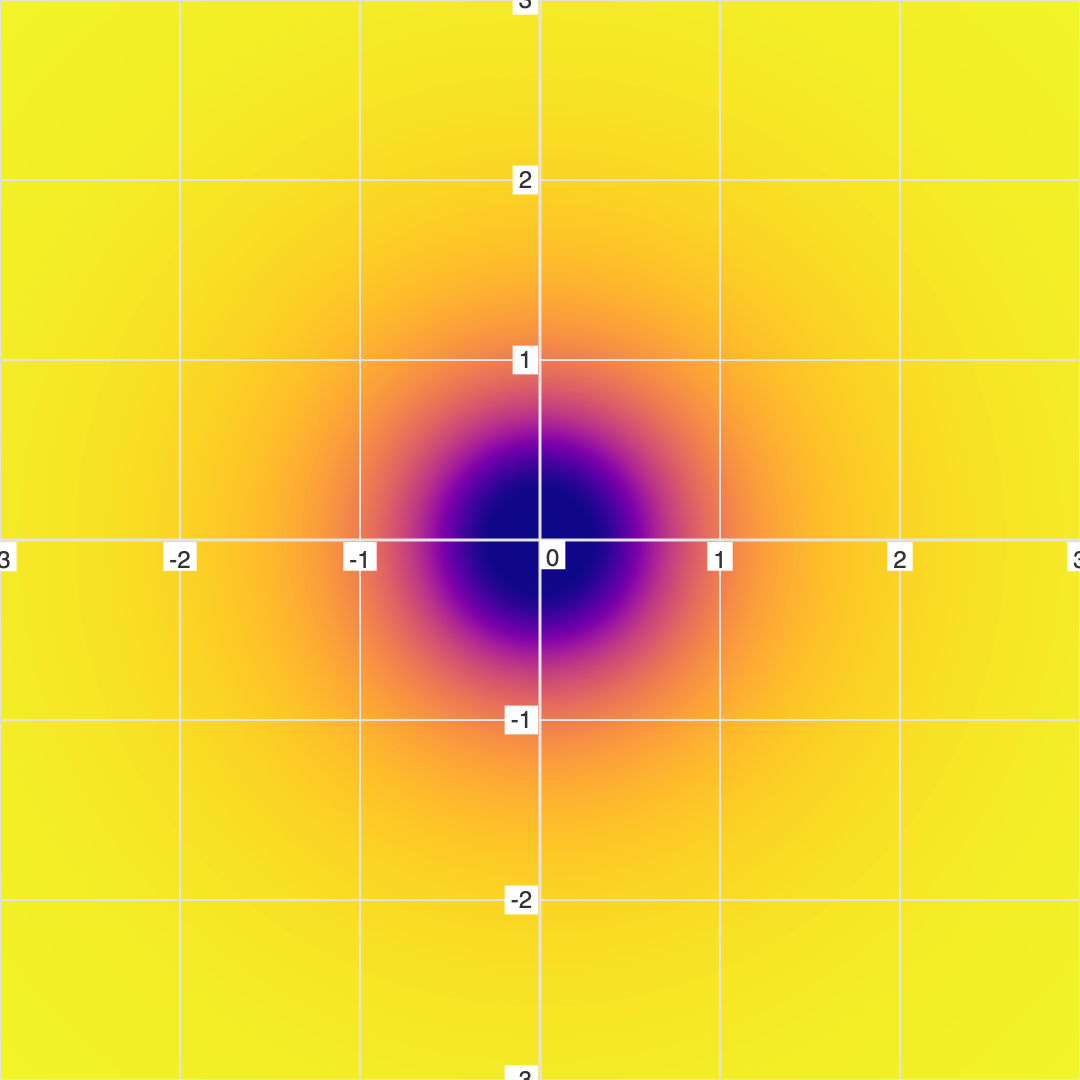
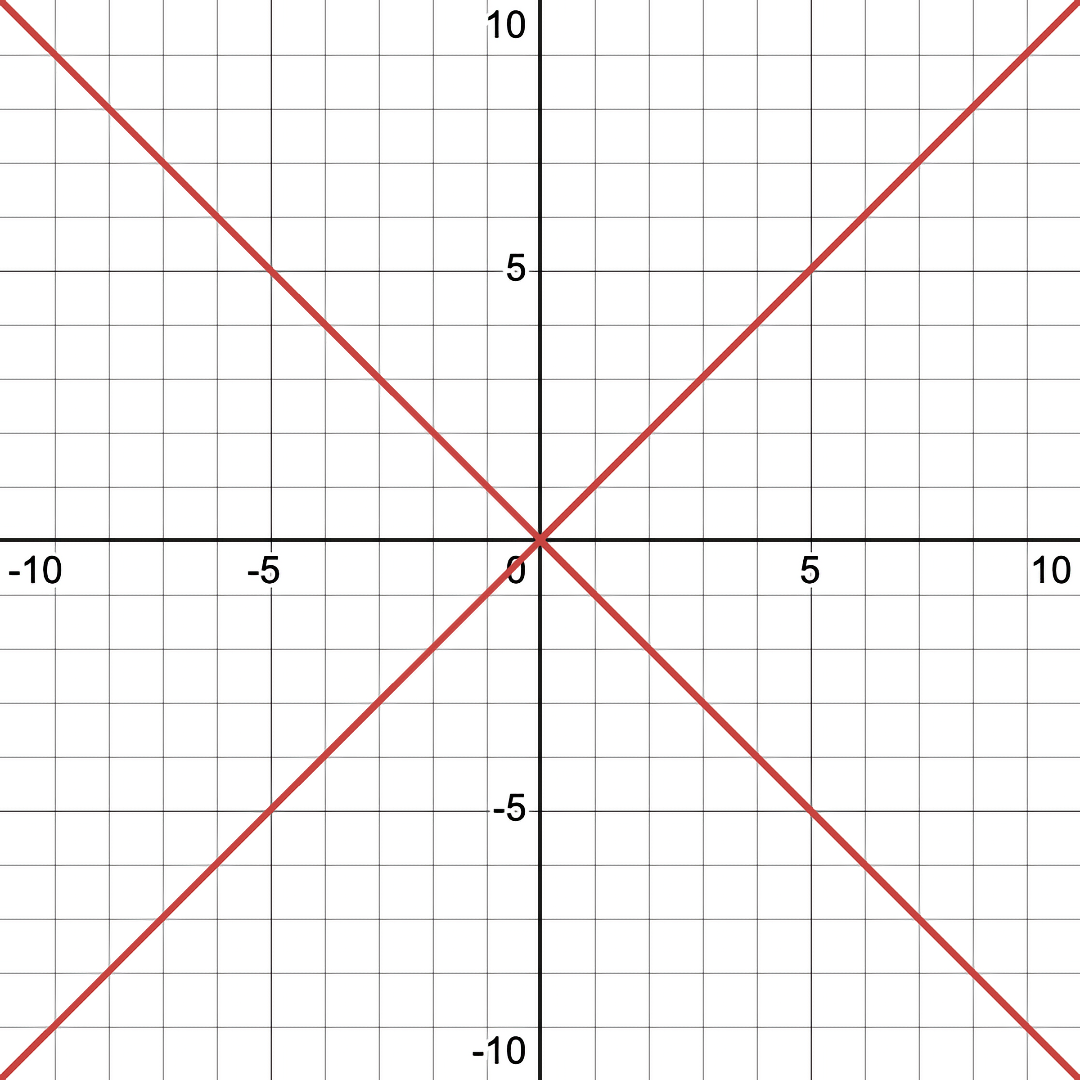
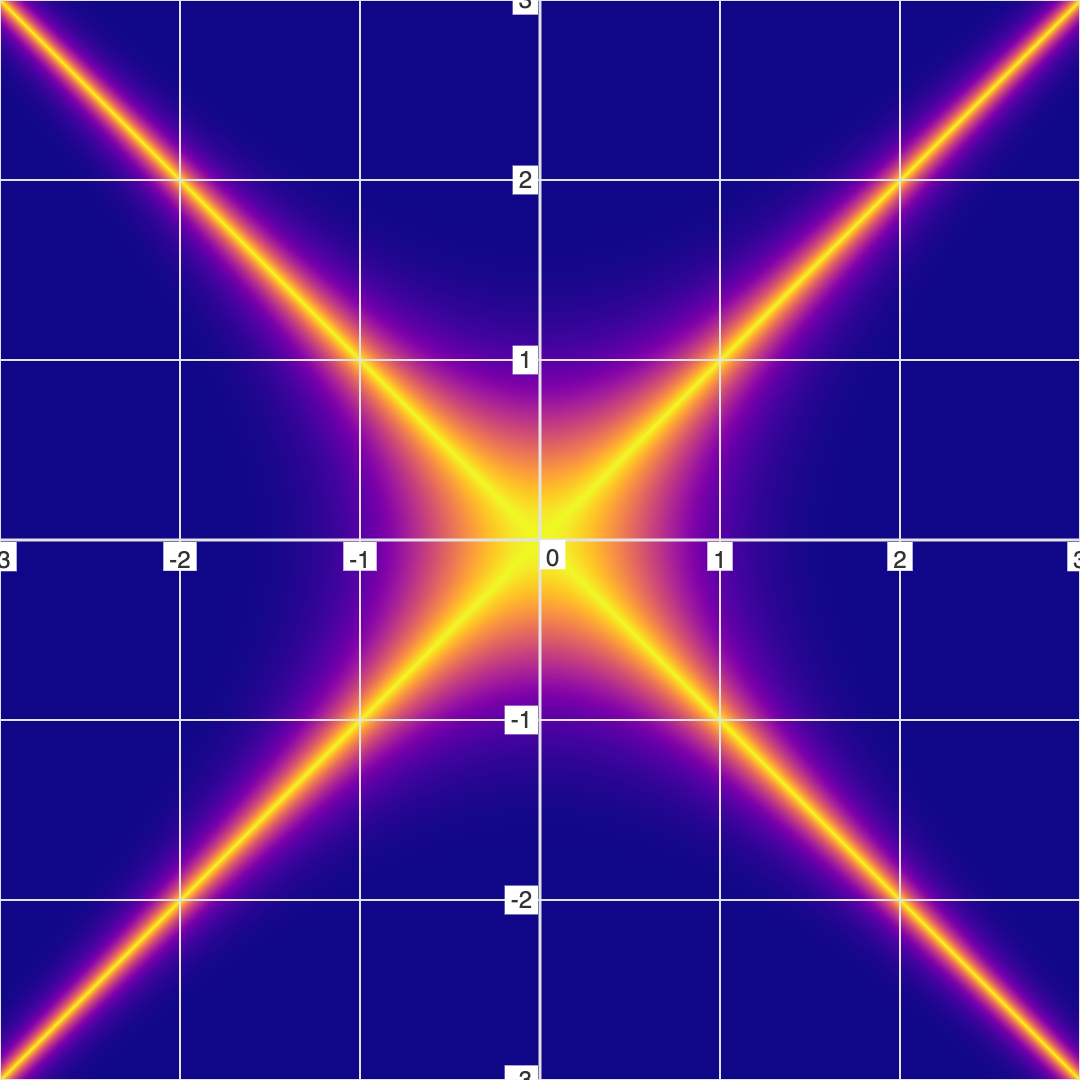
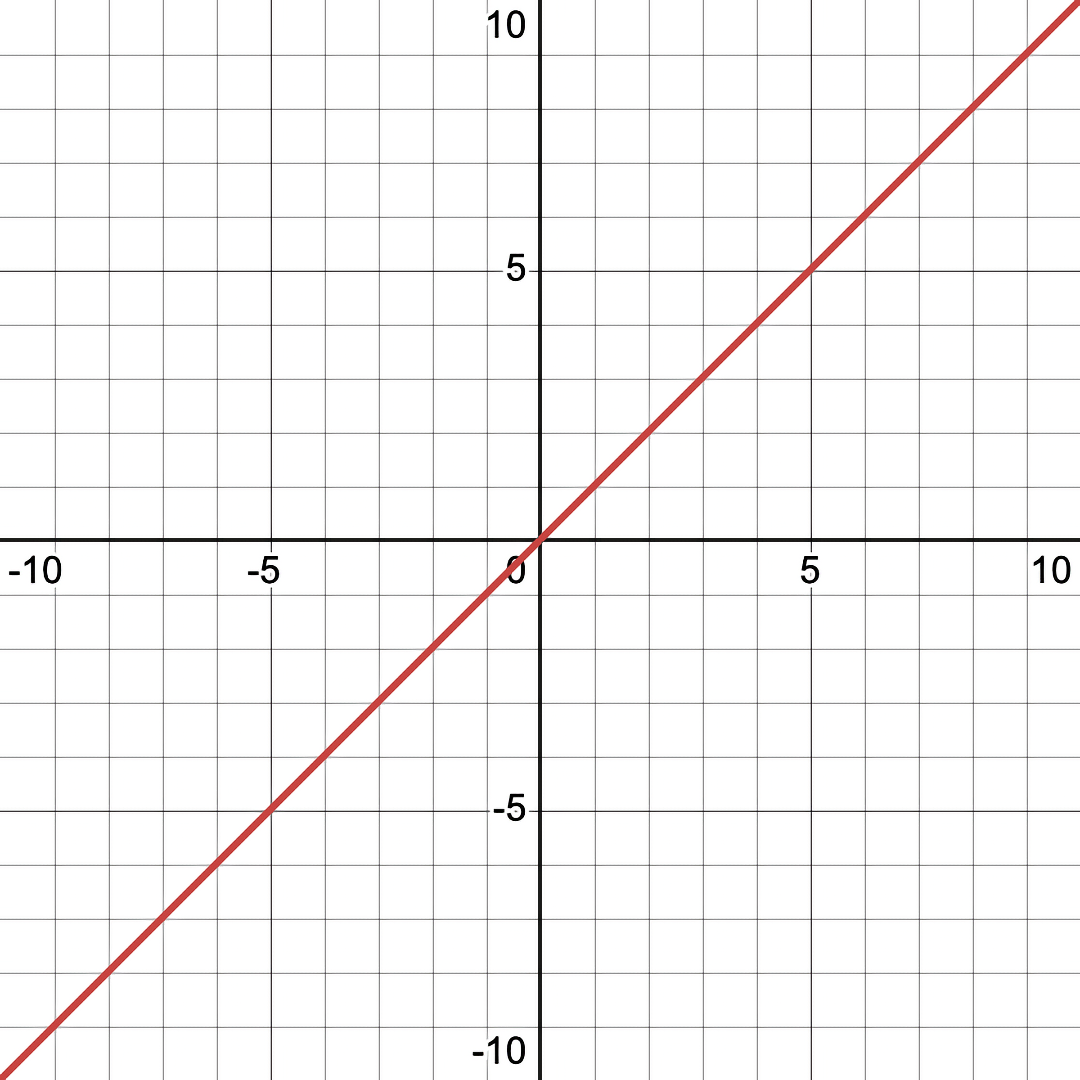
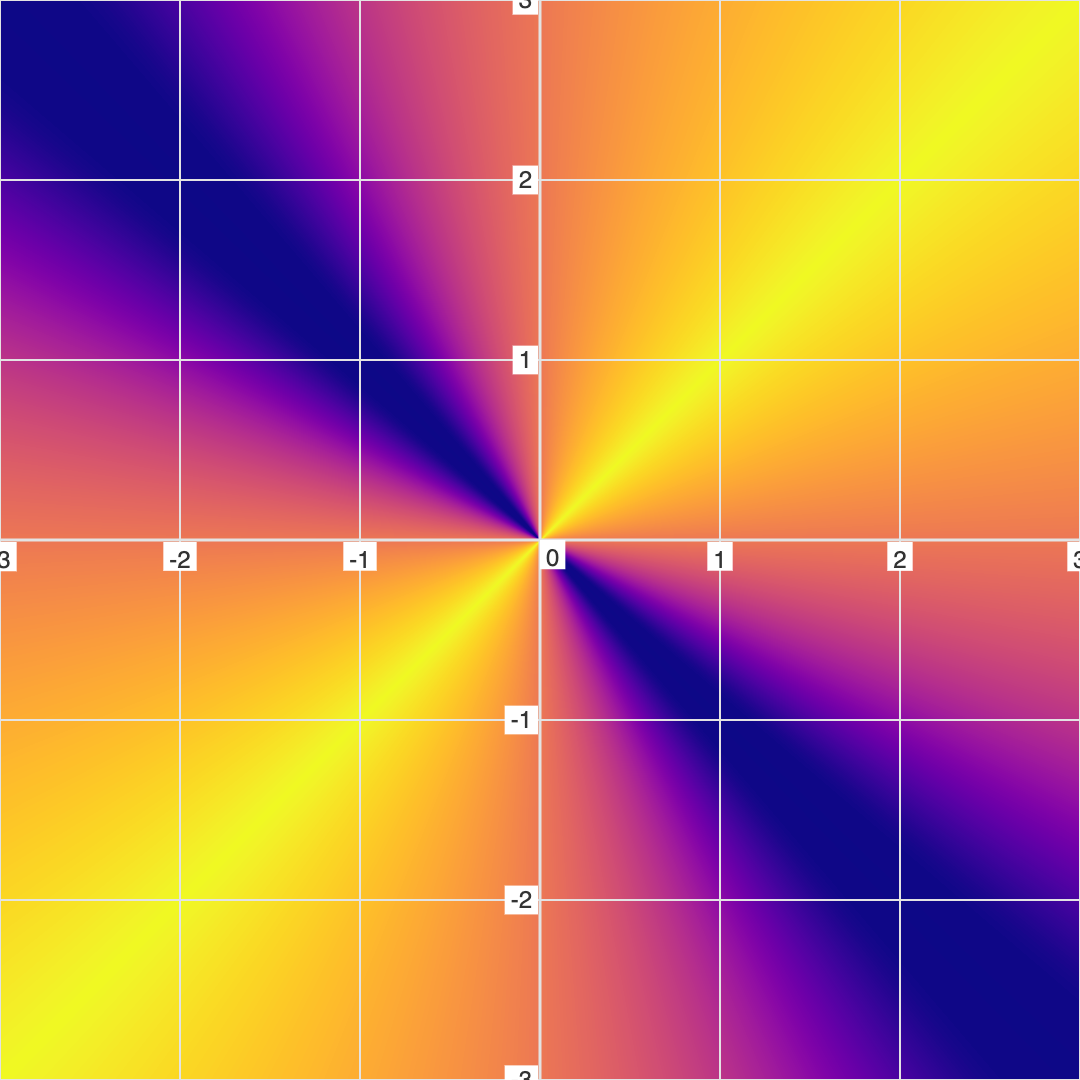
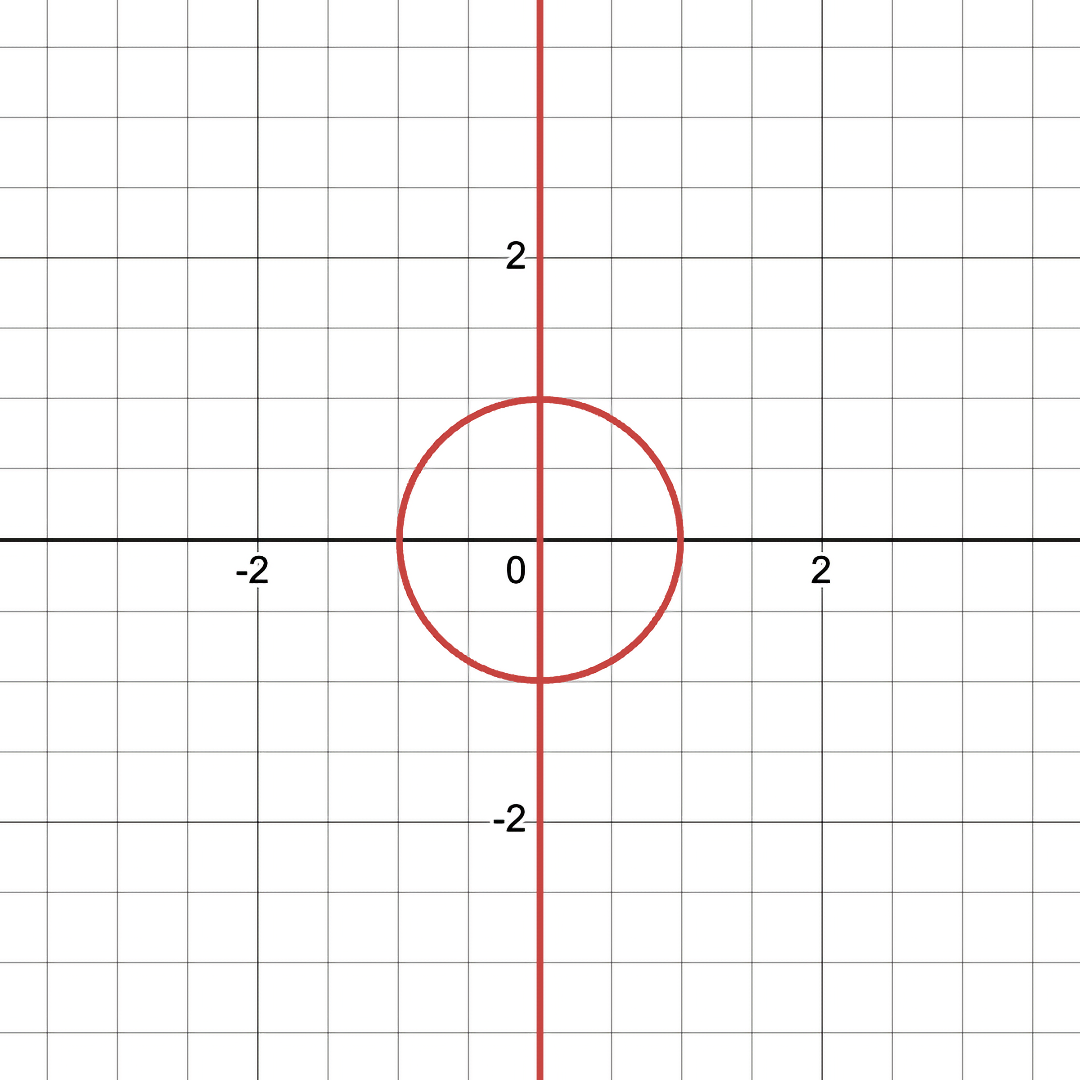
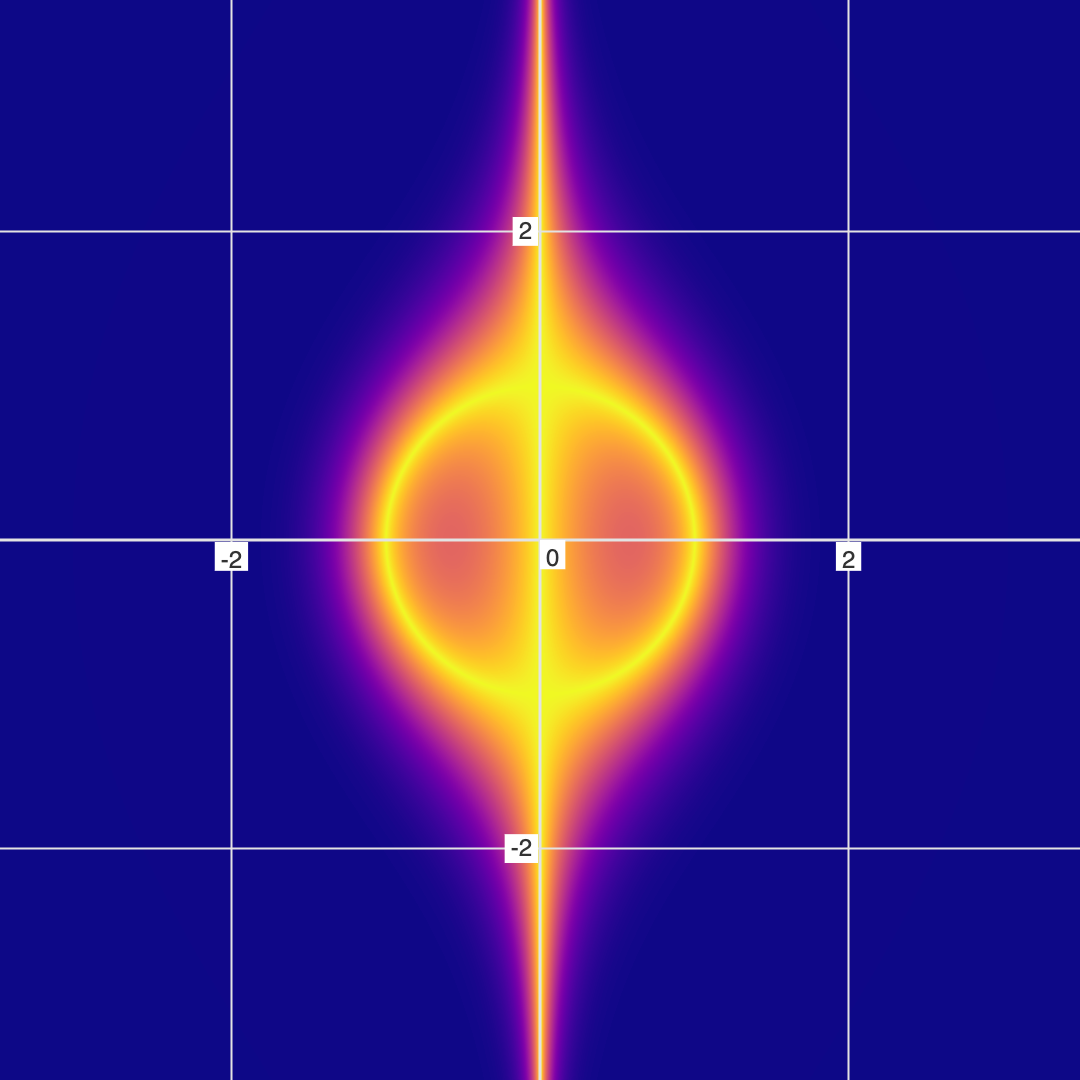
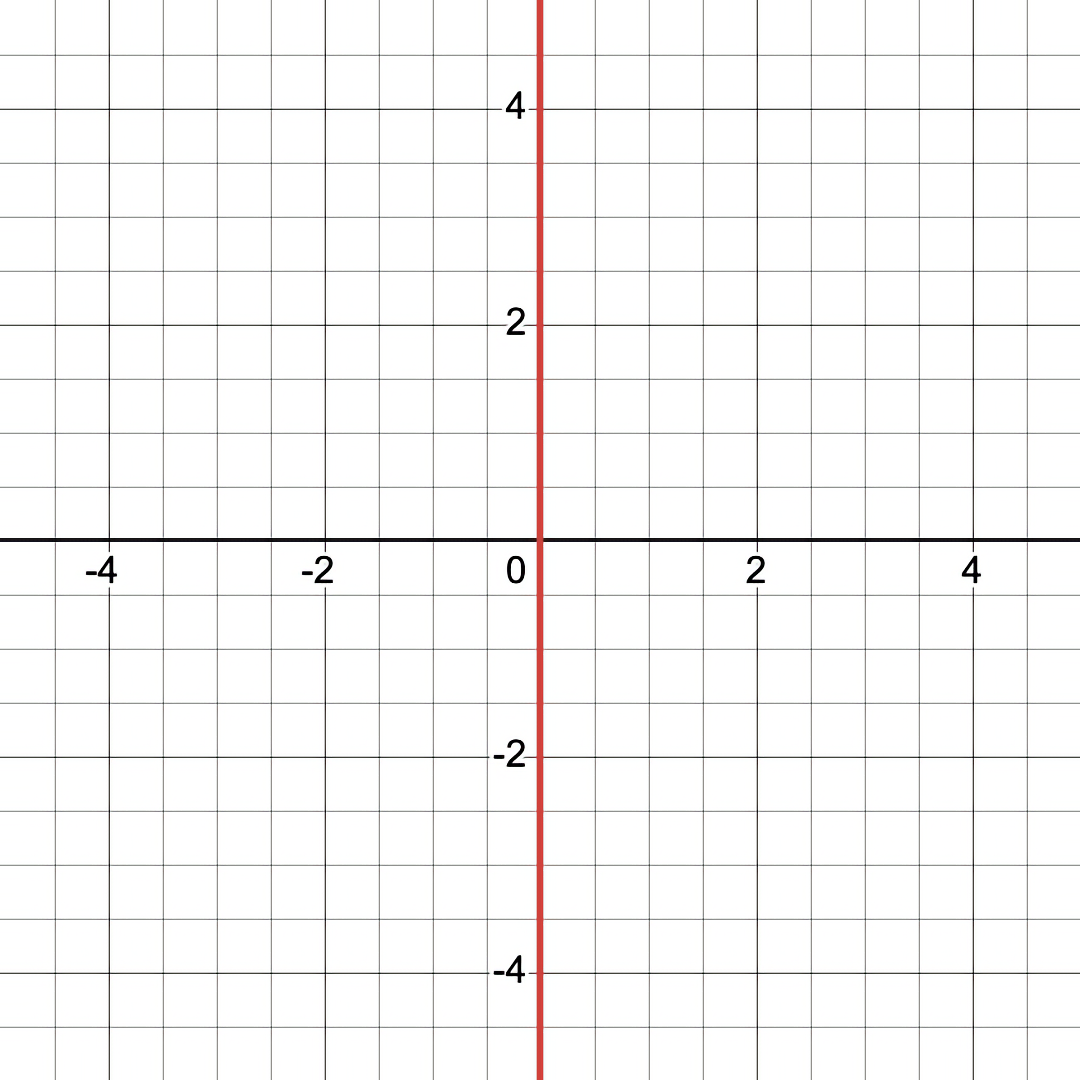
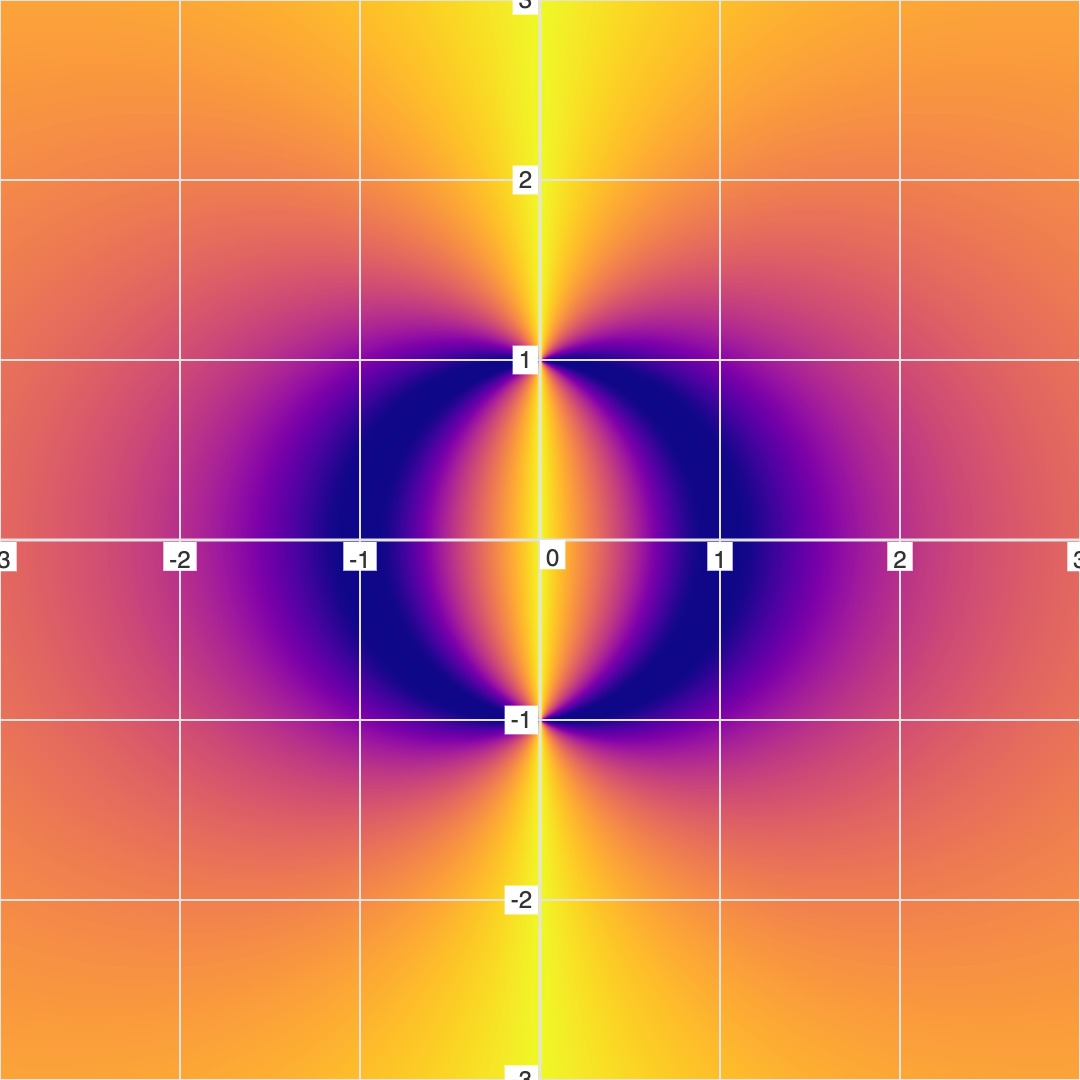
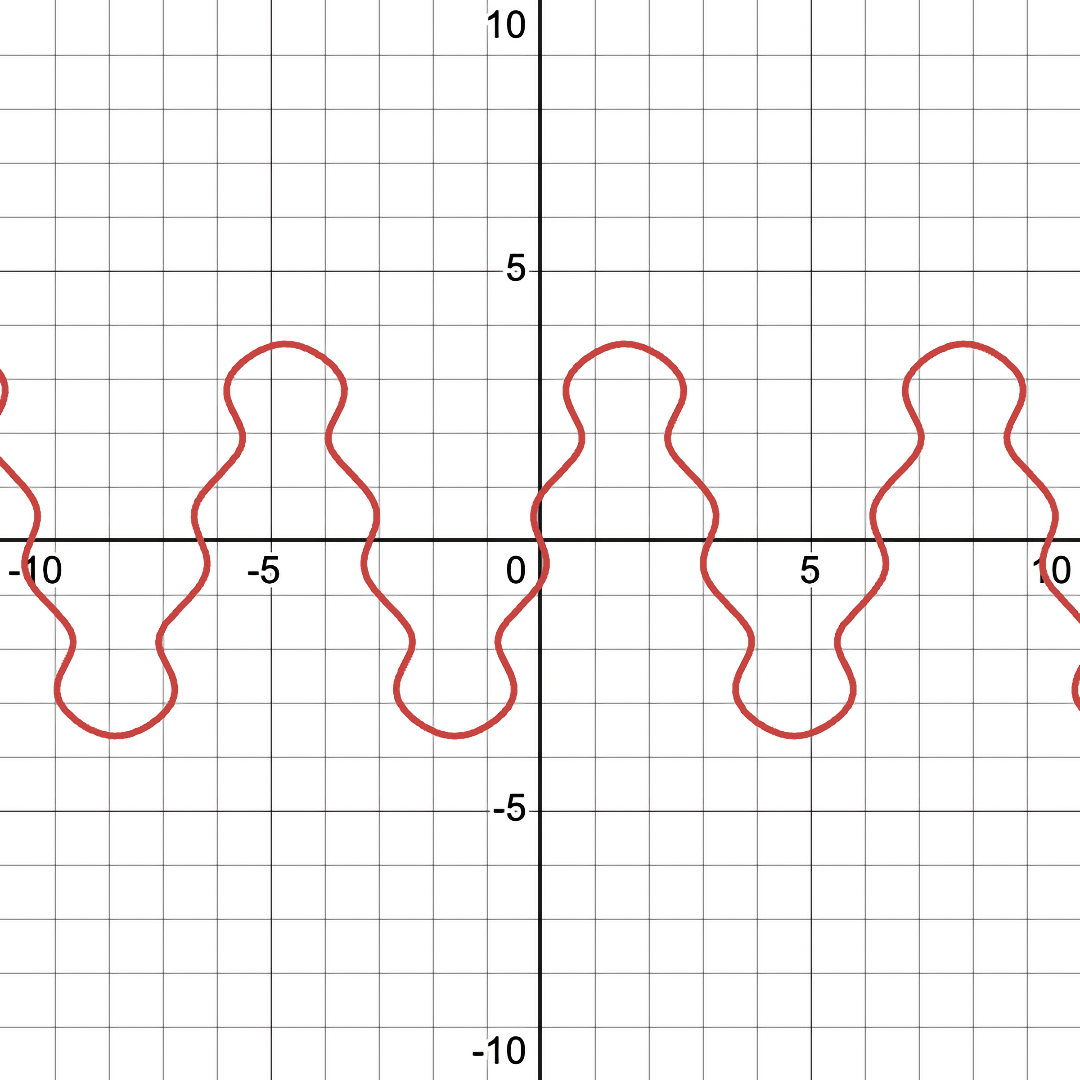
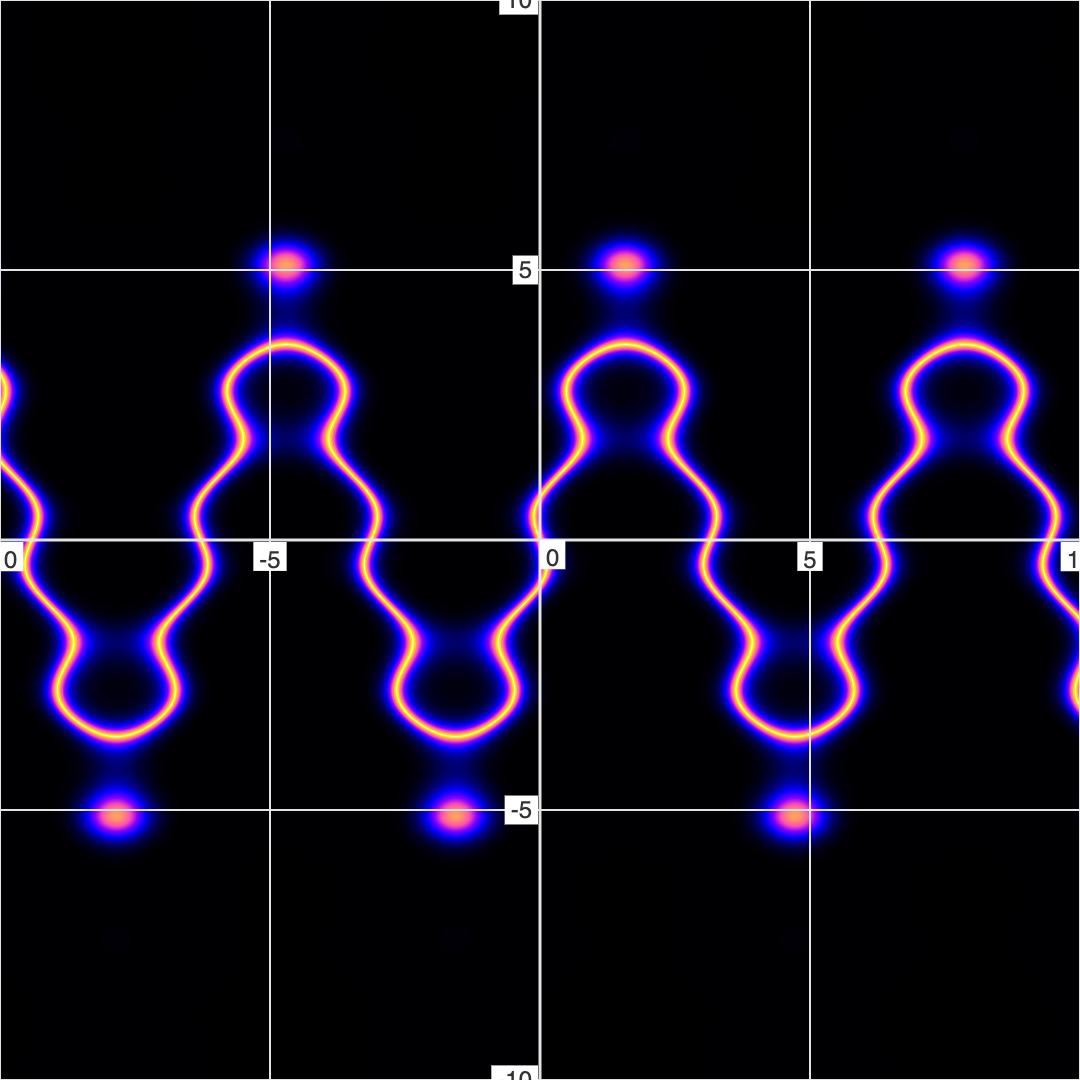
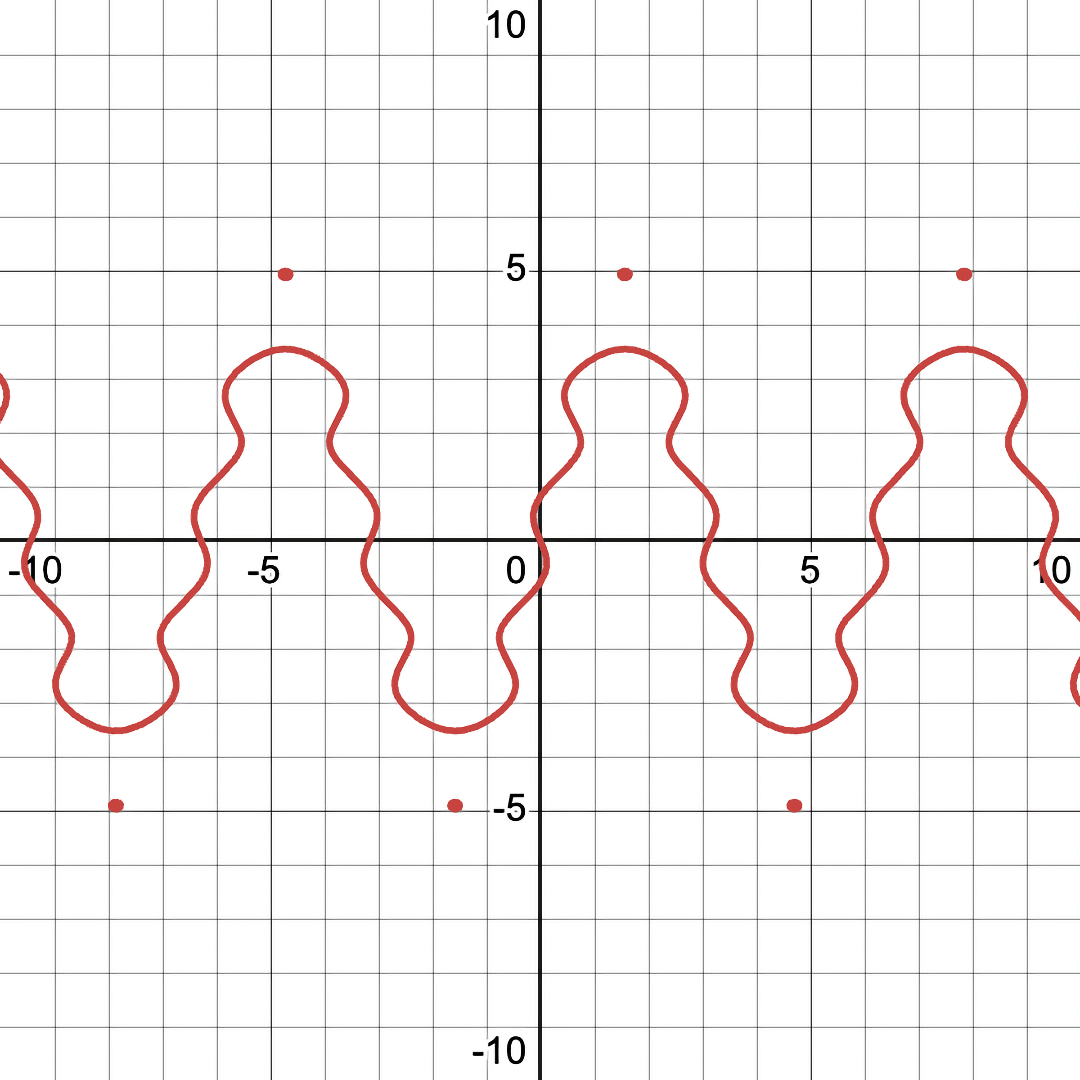
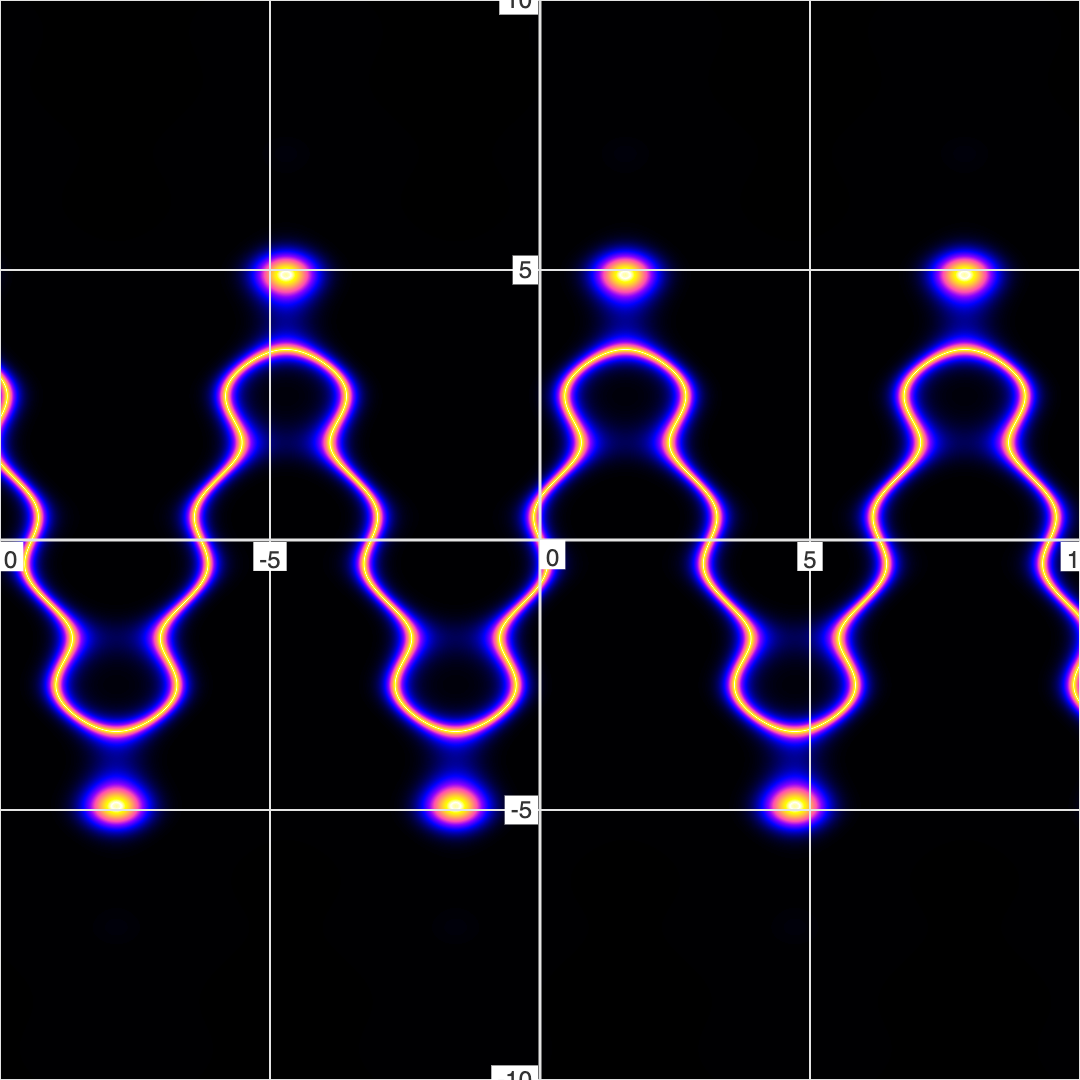
If you've ever graphed equations, chances are you have only ever graphed equations in what I refer to as "Binary mode" - which draws a line where the equation is EXACTLY equal, and leaves white everywhere else. FuzzyGraph , on the other hand, visualizes equations in a Fuzzy/Non-Binary mode - showing not only where an equation are exactly equal, but also where the equation nearly equal and where the equation is far from equal (where the error is high). And when we look at things in this Non-Binary way , we can suddenly see the previously invisible mathematical shadows have been lurking in the equations . Let's look at some examples... Example 1: Slash Dot Equation Here is the "Slash Dot" Equation ( \( \frac{y}{x^2+y^2} = \frac{x+1}{x^2+y^2} \)) as both a conventional and fuzzy graph... Note the giant black hole that is present in the Fuzzy/Non-Binary graph, but invisible in conventional/Binary graphing. This "black hole" feature represents a region of high error in the equation.…