Consider a situation where a plan must be made to satisfy demand 95% of the time. A 0.95 expectile may seem like the right answer; however, the level of the expectile does not represent the proportion of values below the expectile.
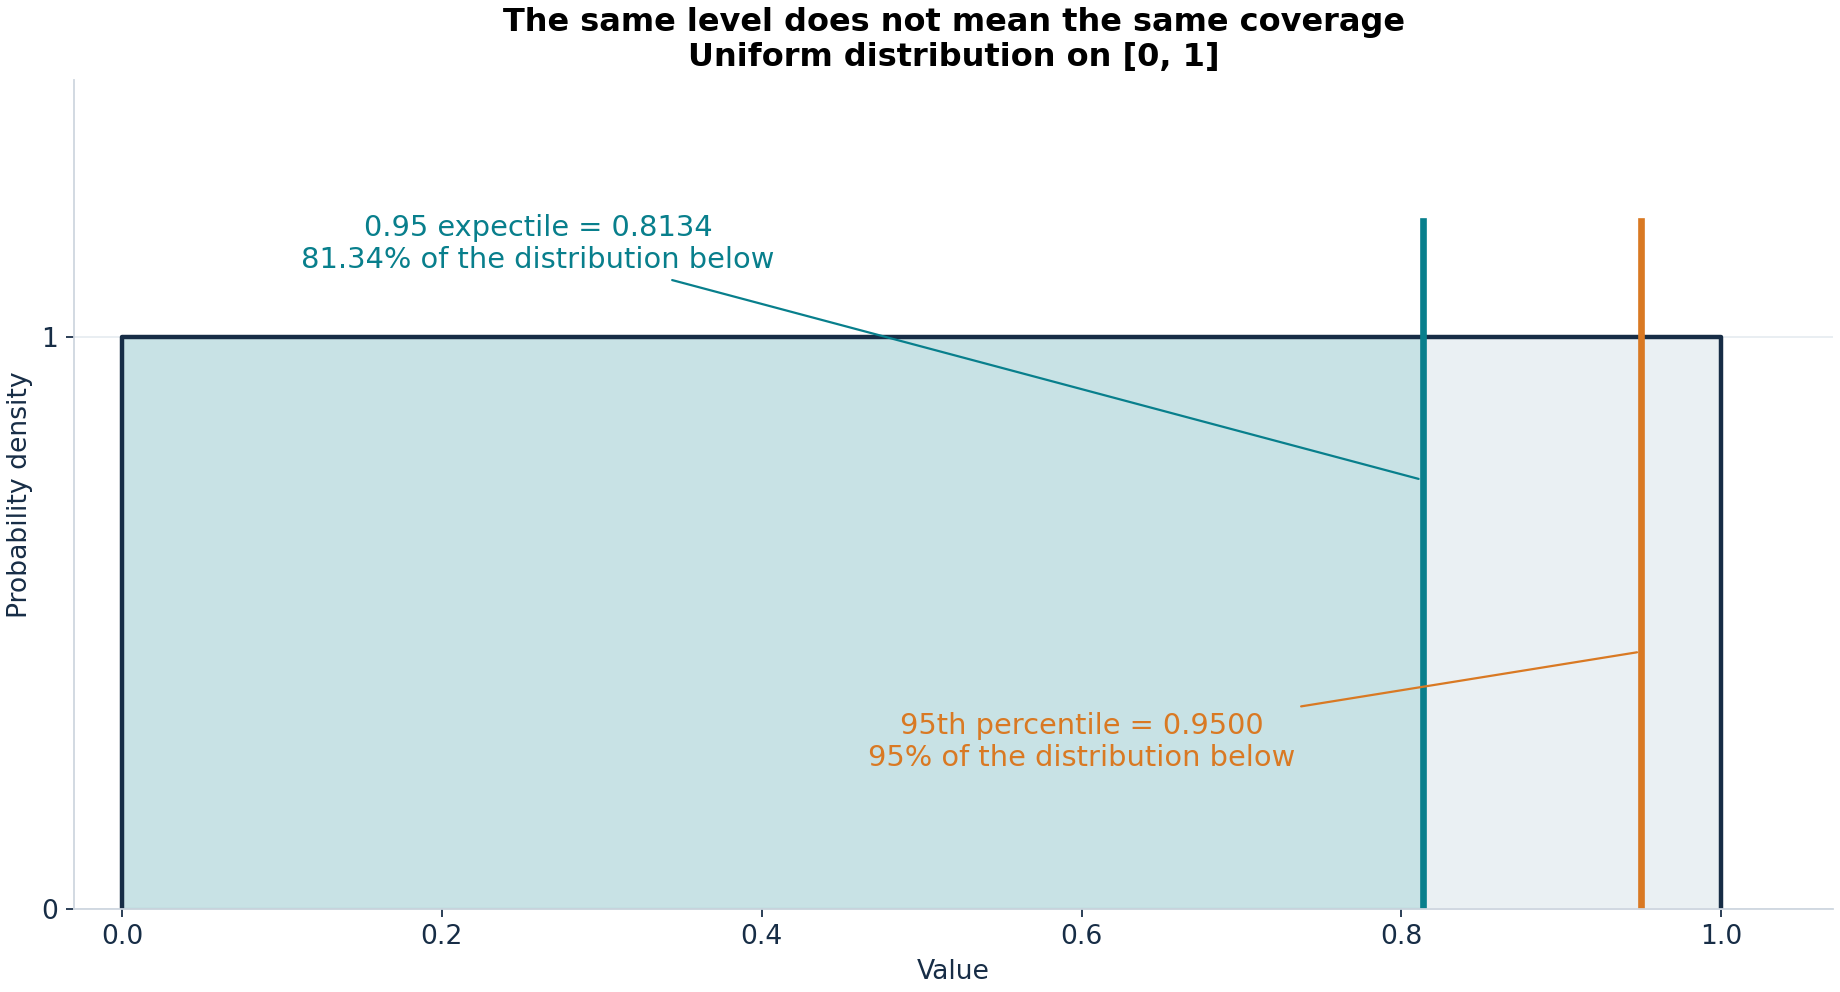
A variable uniformly distributed between 0 and 1 has a 95th percentile equal to 0.95. The 0.95 expectile of that variable is approximately 0.8134. Therefore, only 81.34% of the distribution lies below 0.8134.
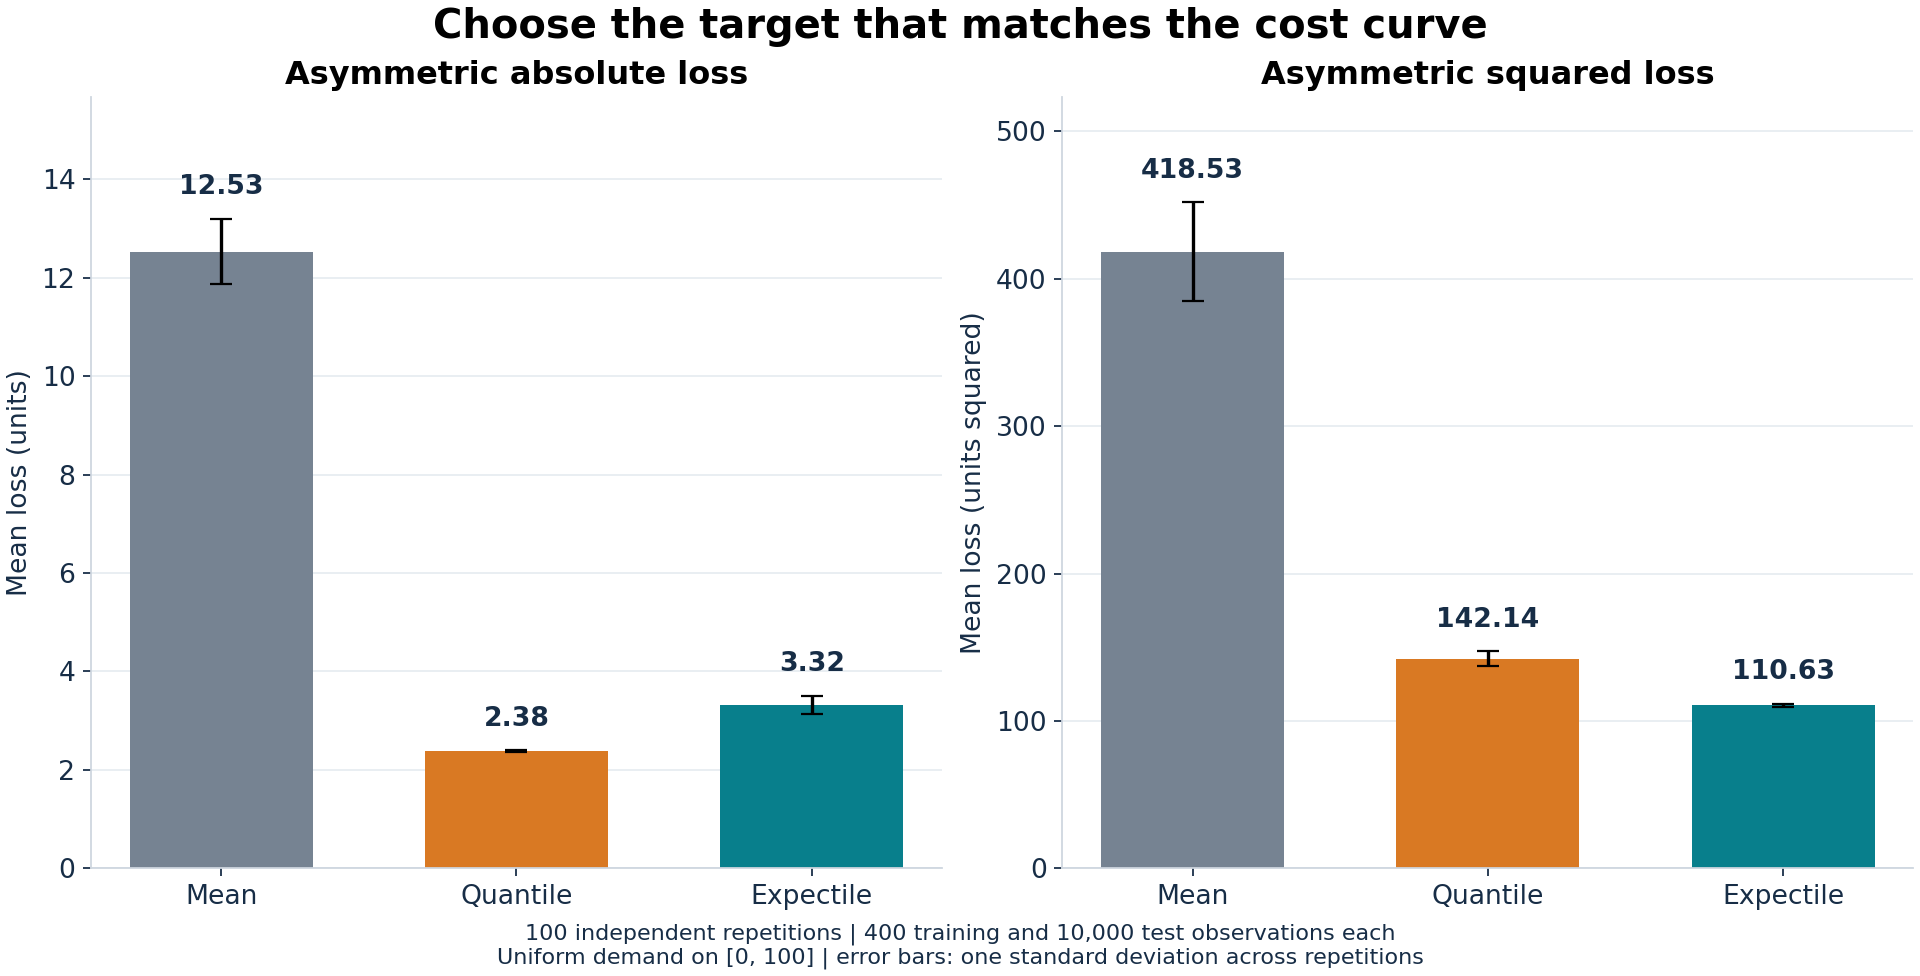
A quantile defines a decision boundary, and an expectile is set to minimize the asymmetric squared error. We will compute the asymmetric losses and compare decisions using the two loss functions in Python. Synthetic data will be used for all examples.
Start with the question the statistic answers
A cumulative distribution function gives the probability that a random variable is less than or equal to a given value. For a continuous, strictly increasing CDF, the value associated with a cumulative probability of alpha gives us the quantile at level alpha.…