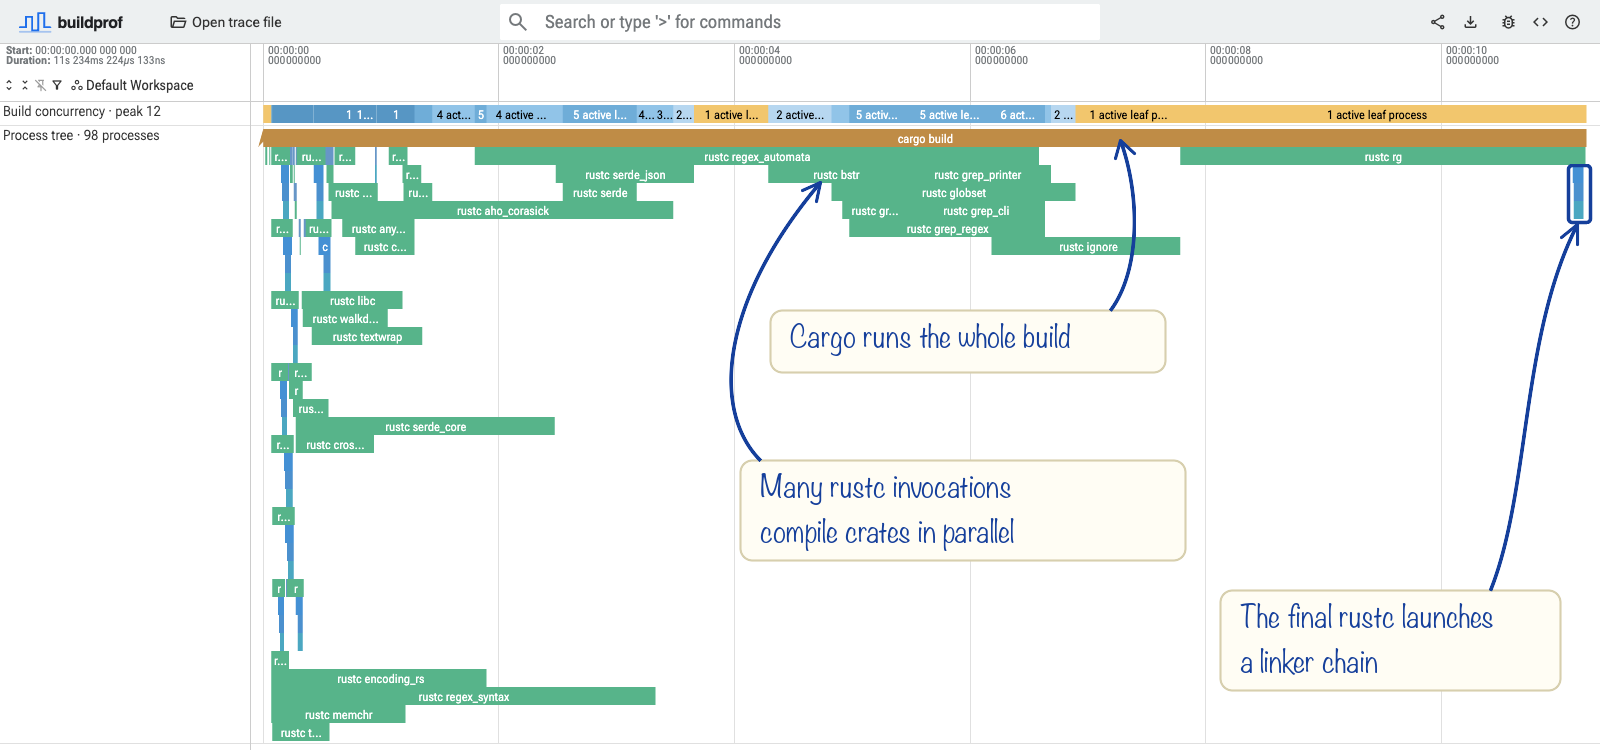
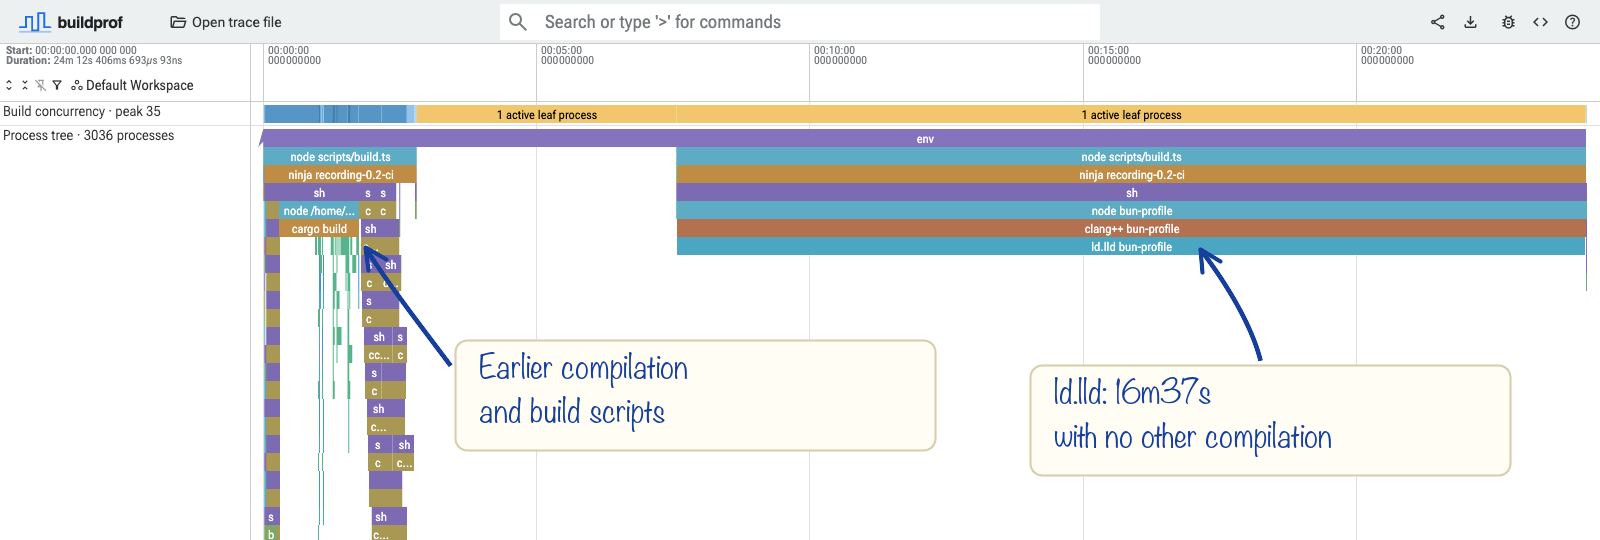
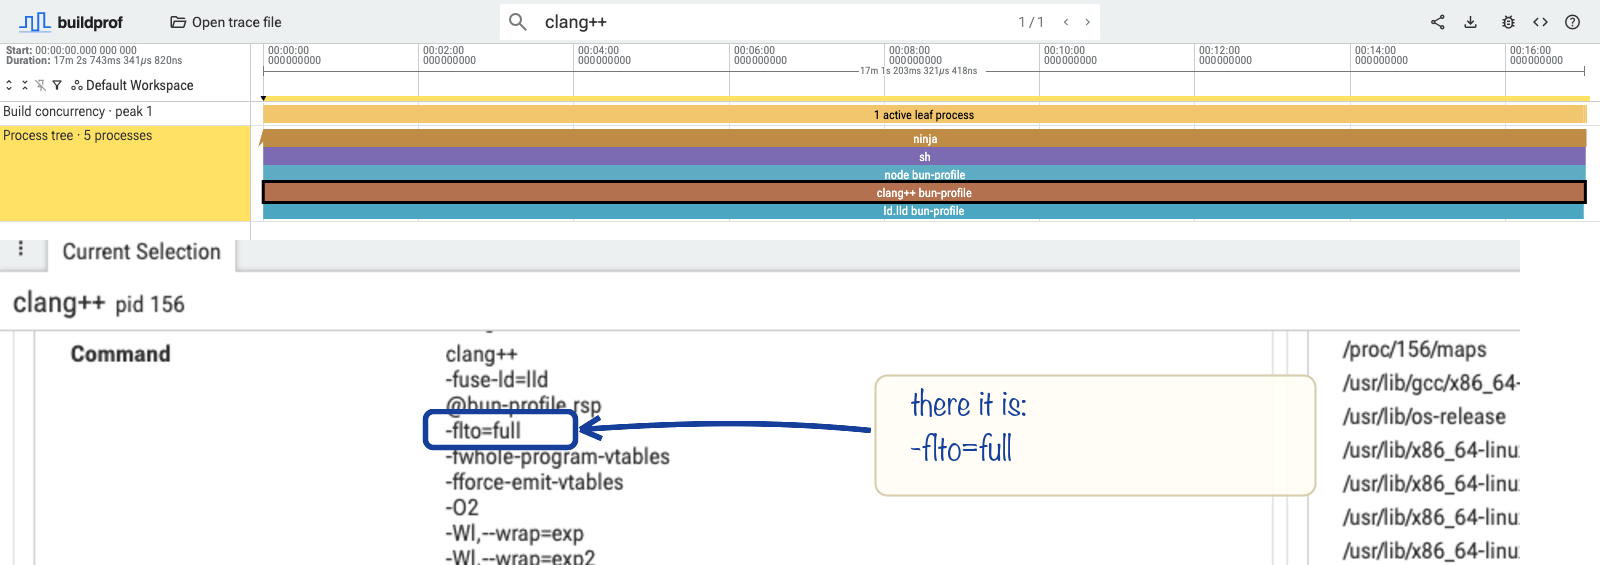
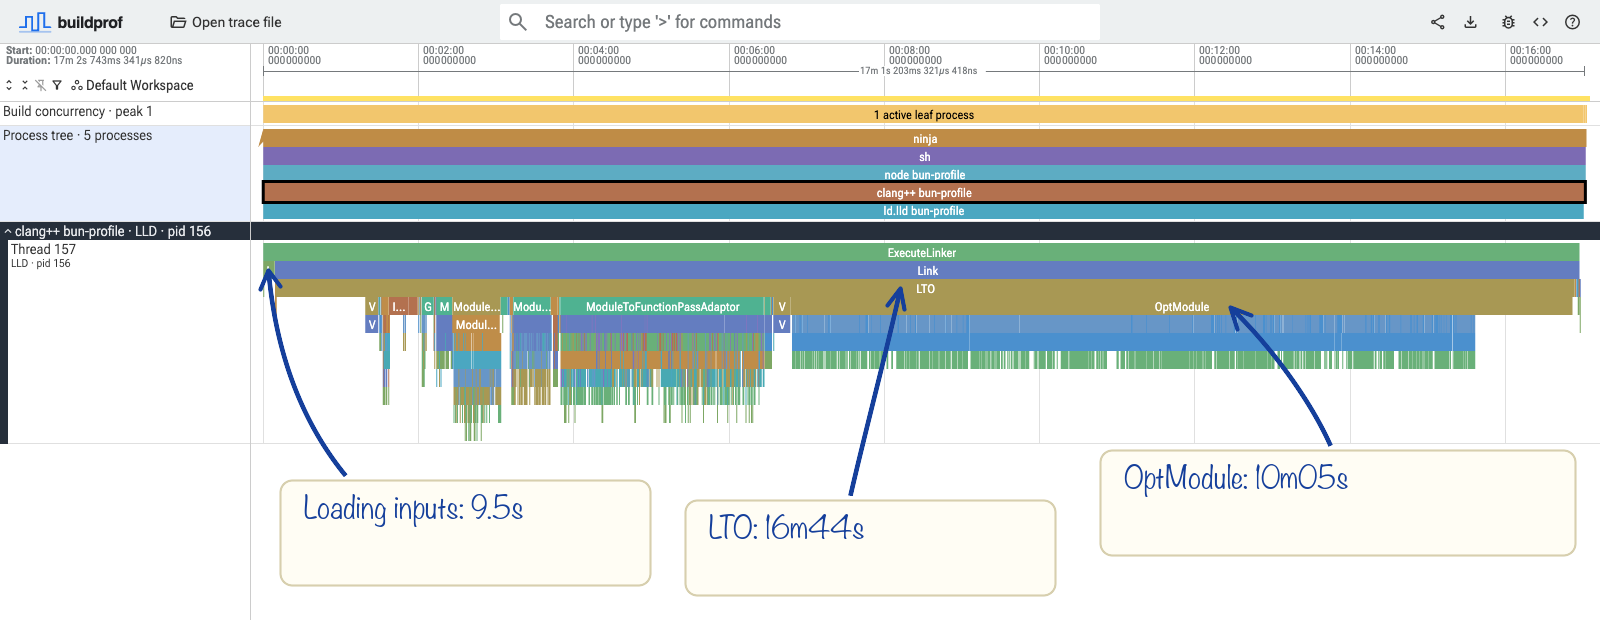
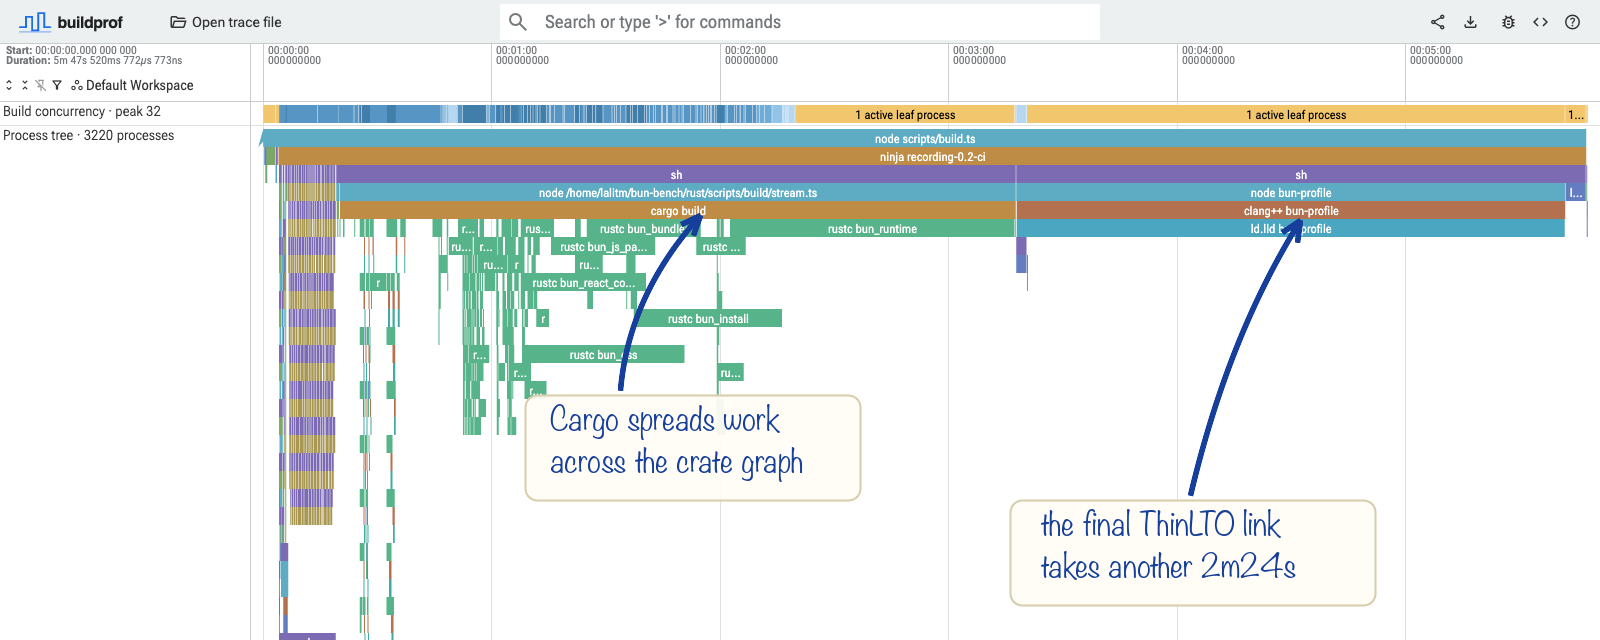
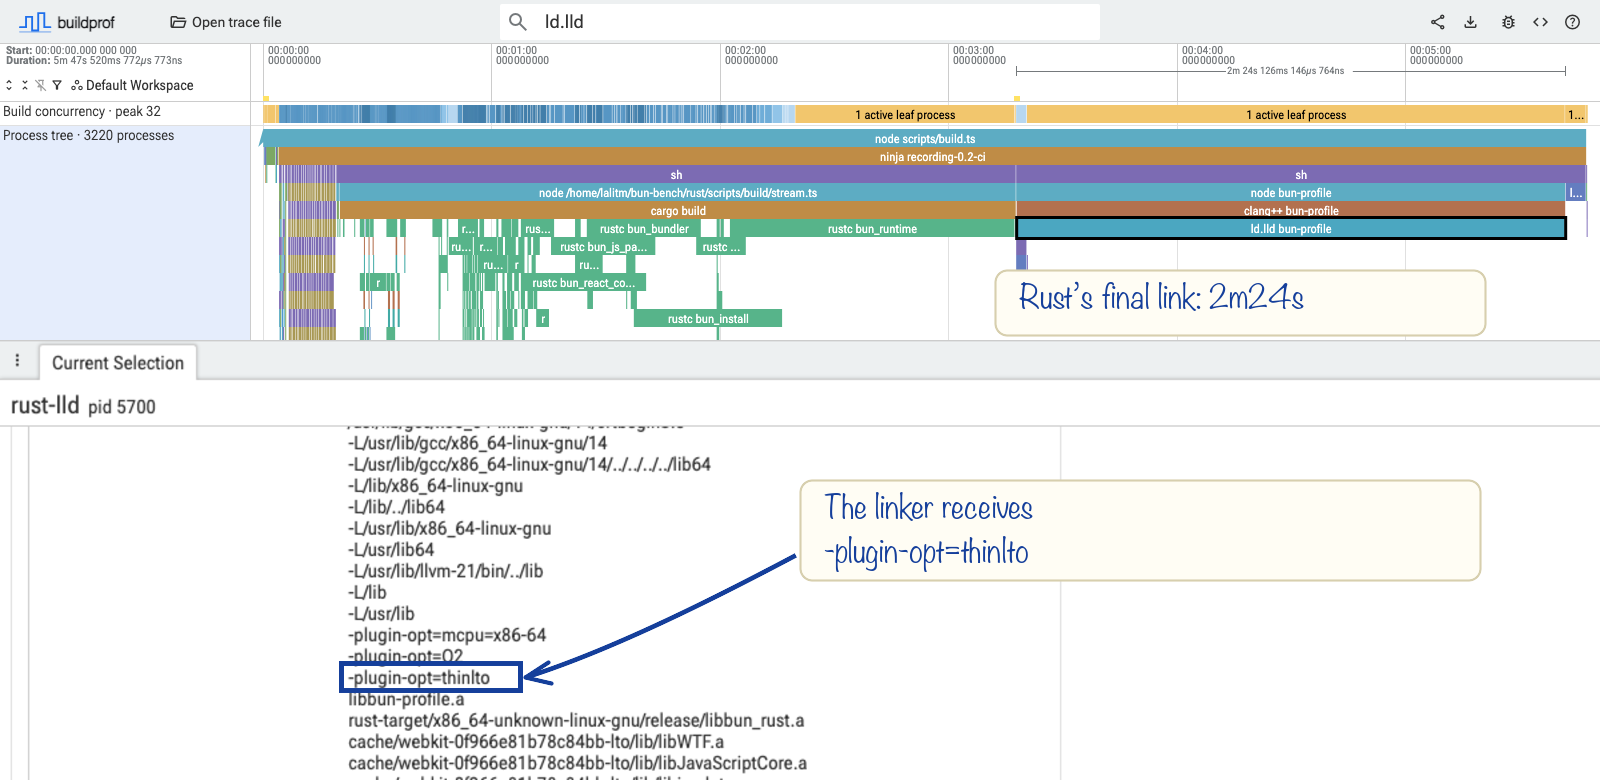
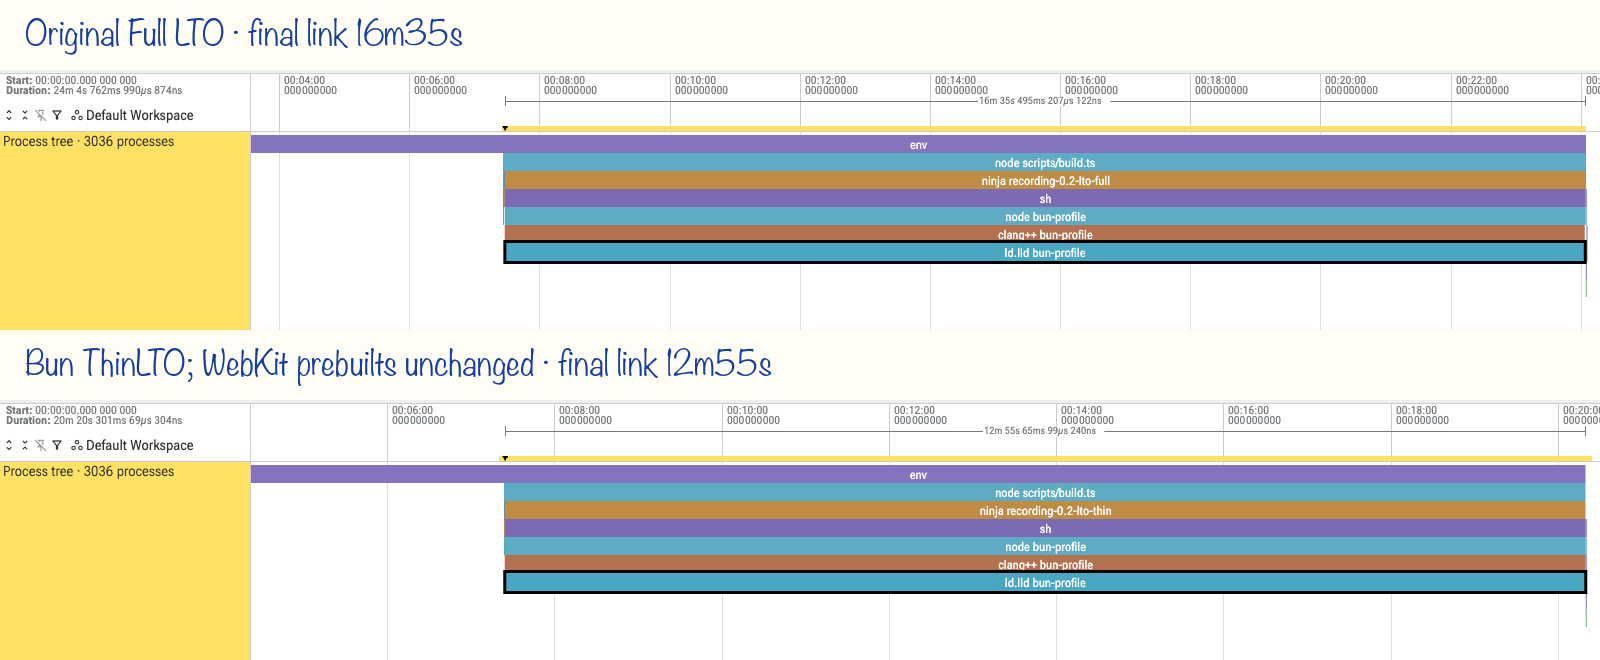
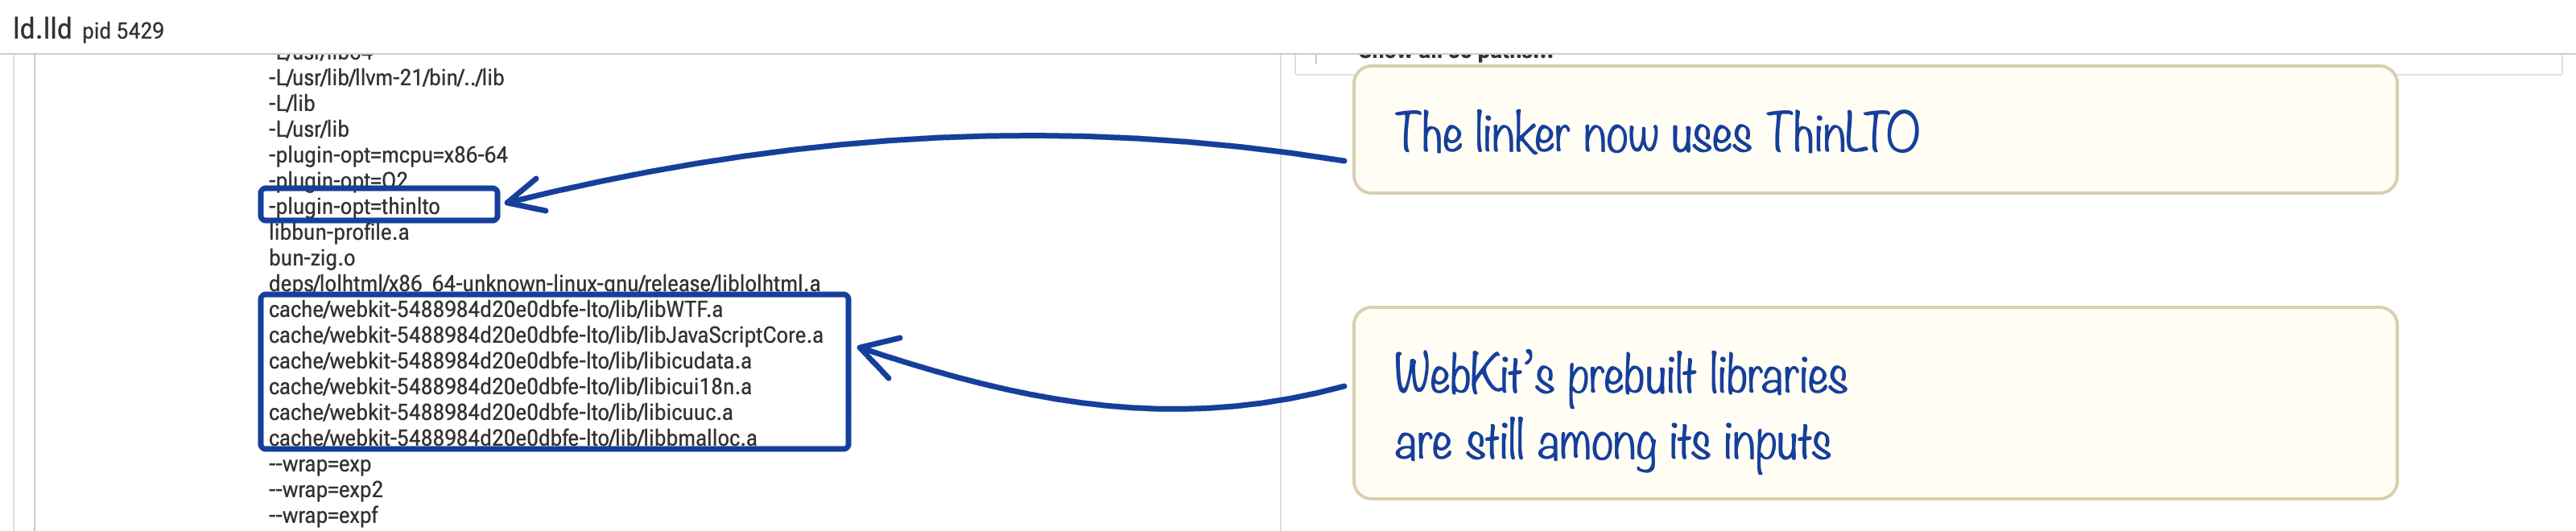
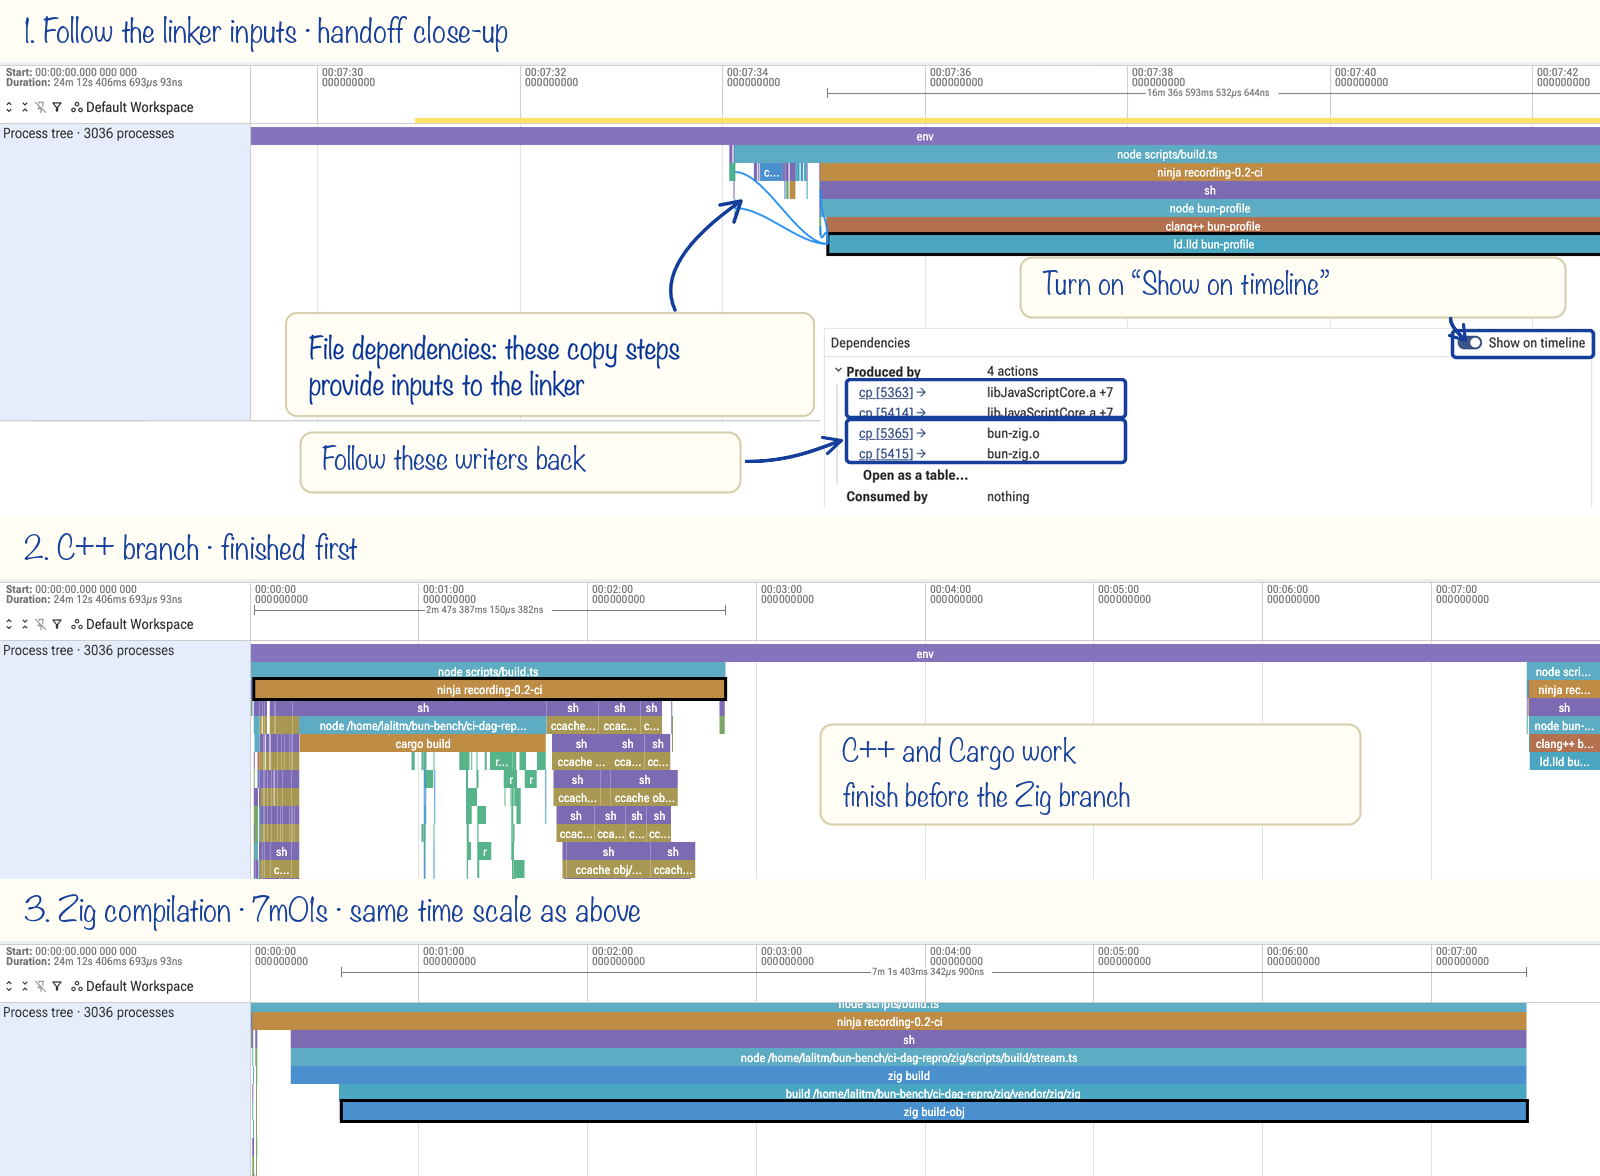
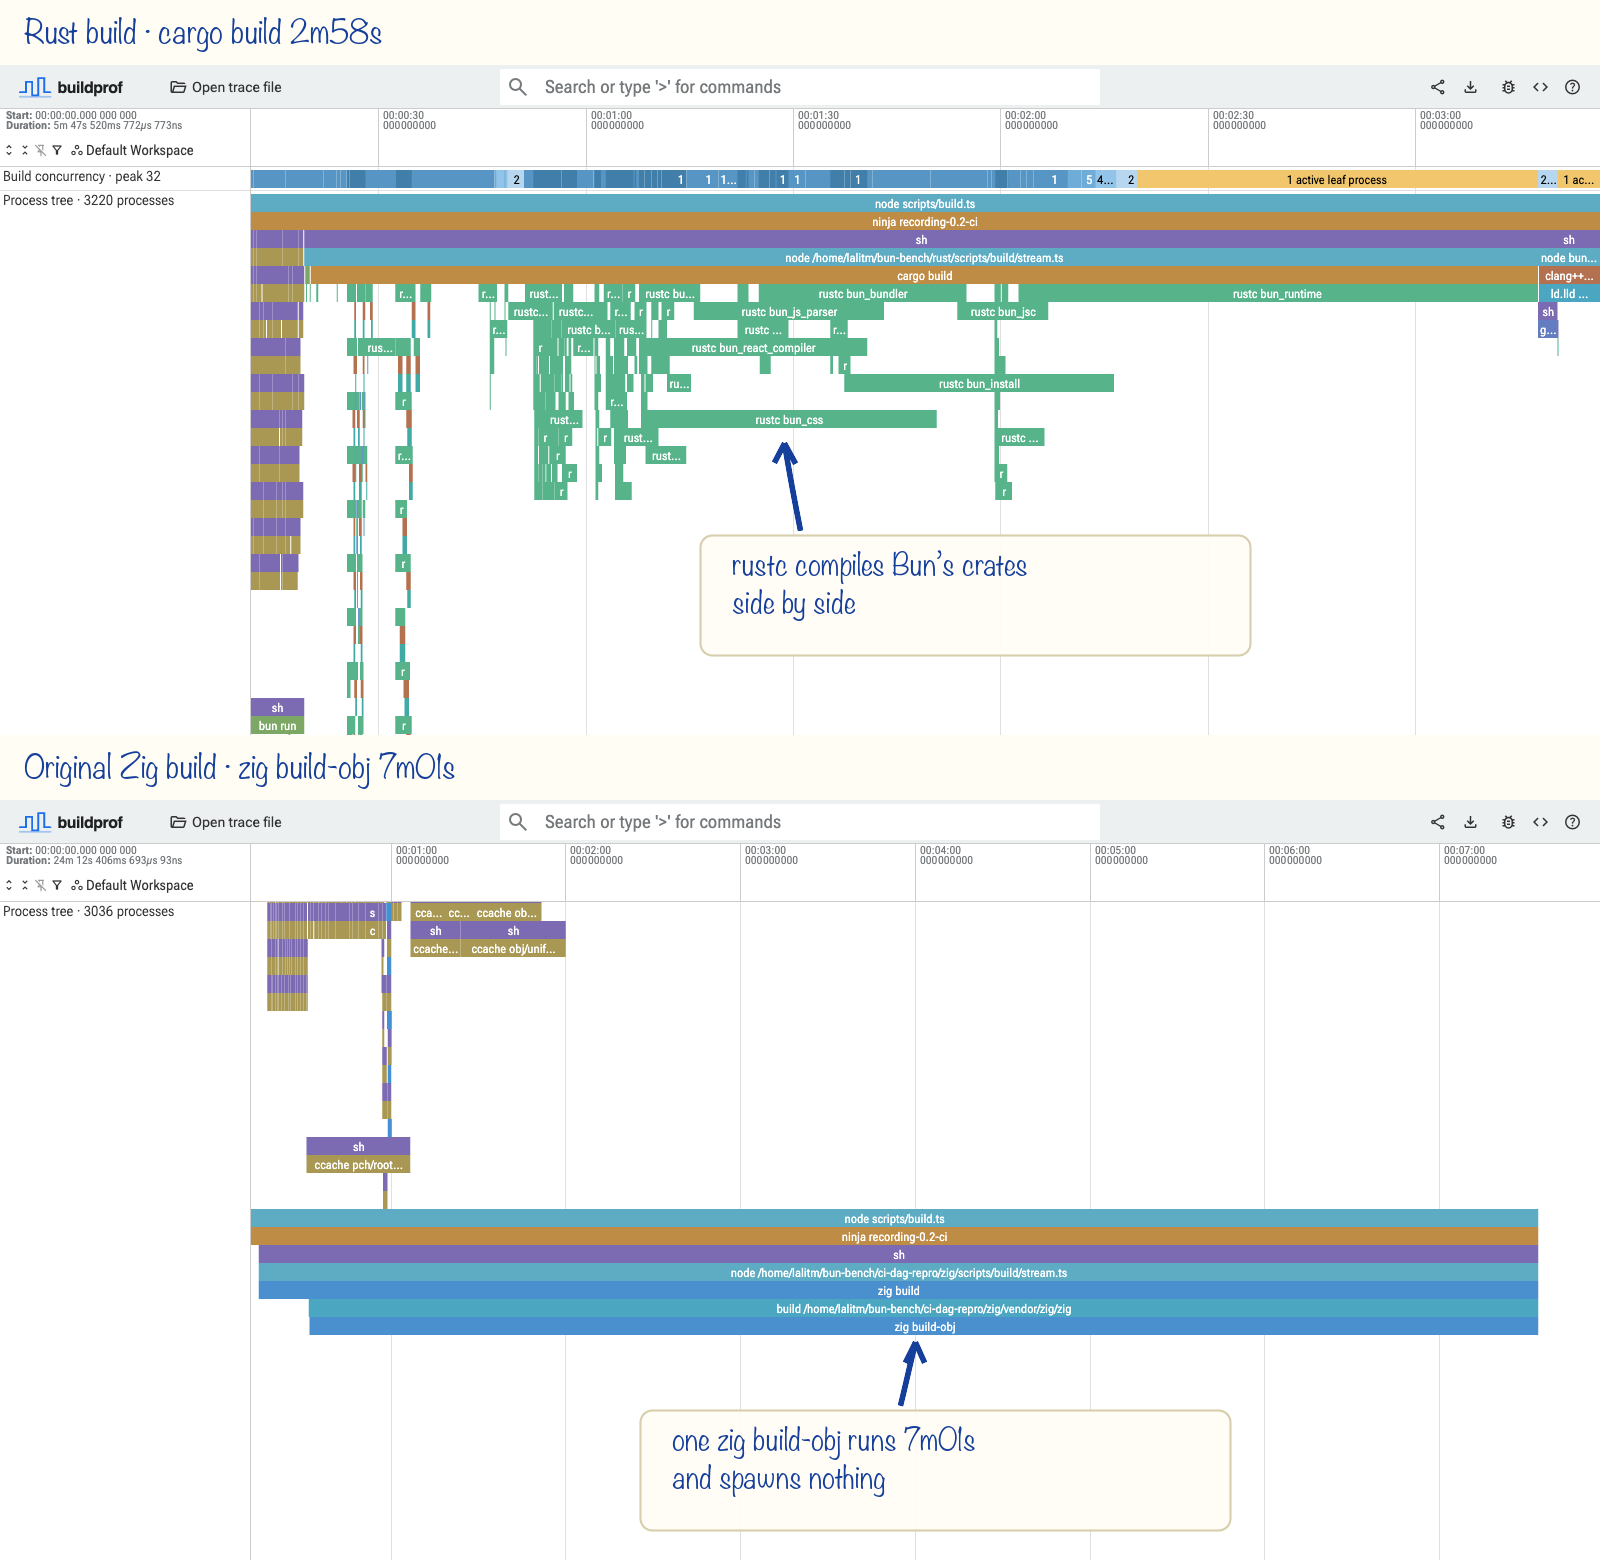
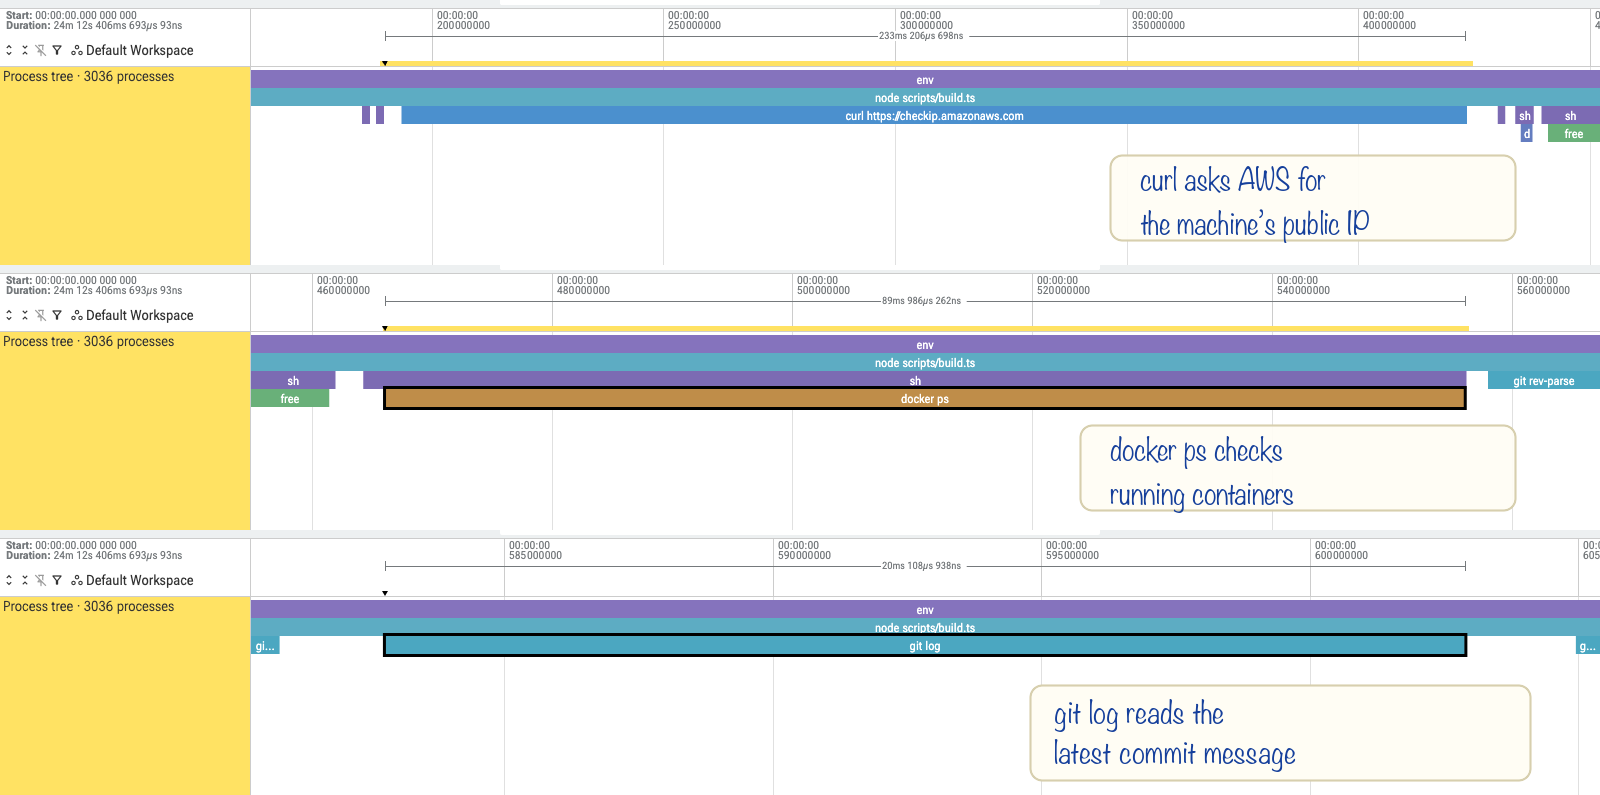
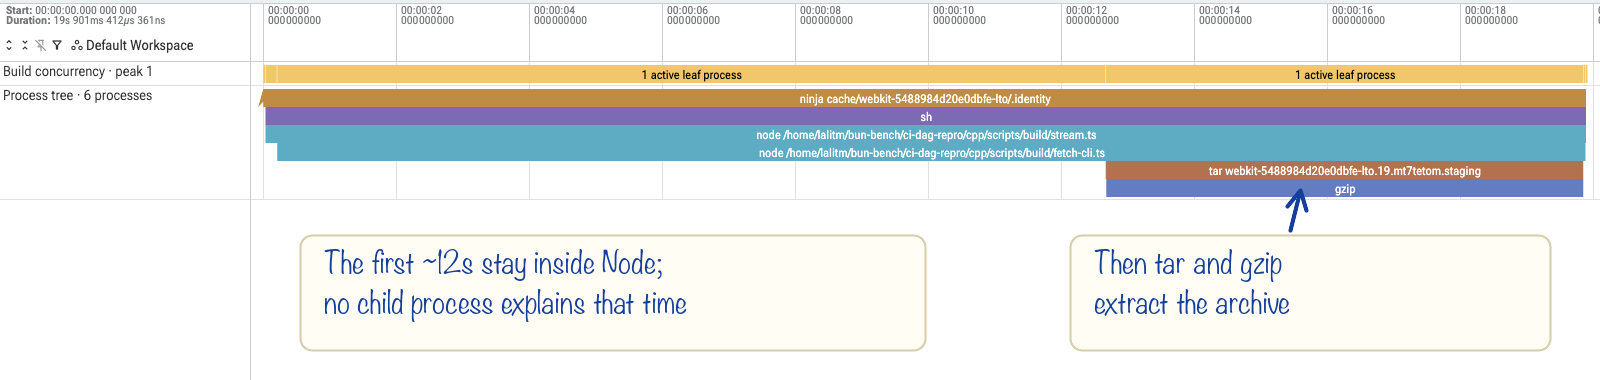
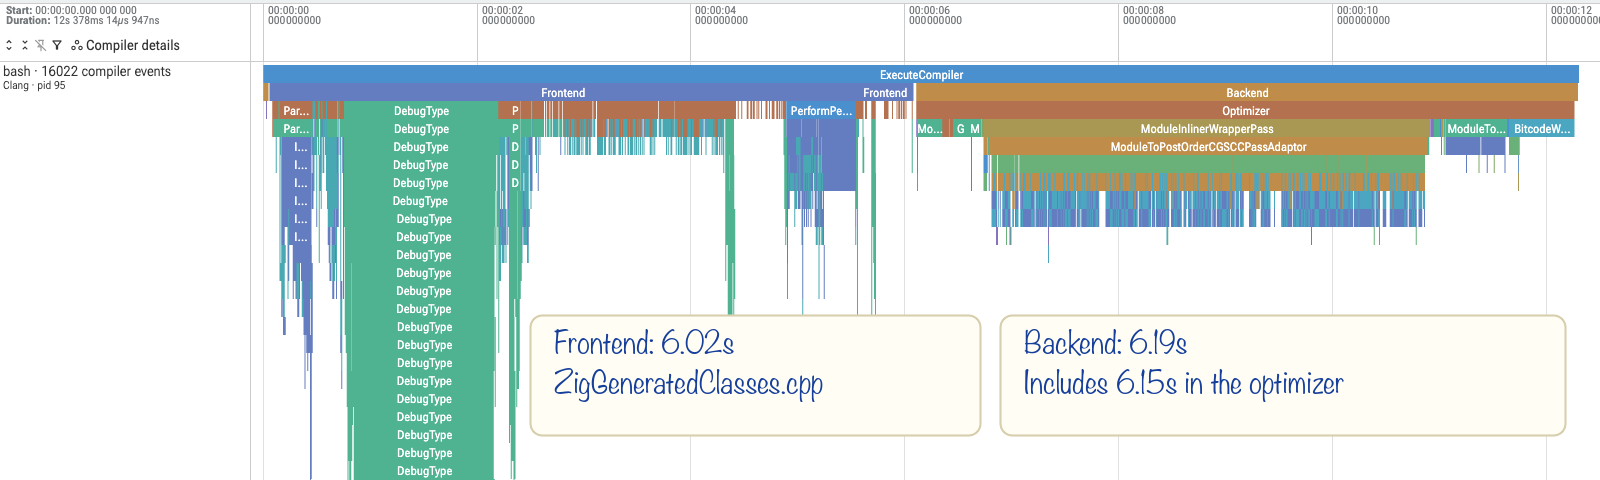
I built buildprof ( Github ), an open-source tracing tool that shows where the time goes when you compile software on Linux. Here’s a realtime video of it profiling a clean build of ripgrep: Watch the buildprof demo Sometimes, builds are slow because there is simply a lot of code to compile. But more often than not, there are fixable problems: poor parallelism, repeated work, dependency downloads or a huge compiler/linker invocation. buildprof makes all of this clearly visible, so you can see what’s worth investigating and optimizing. You run it by putting buildprof -- in front of any build command you already use: buildprof -- make -j16 buildprof -- cargo build buildprof -- ninja -C out/target buildprof -- just build buildprof -- ./dev/custom-build-script.sh buildprof records every process your build command launches, including their subprocesses (and their subprocesses…), and lays them out on one timeline.…