At a glance
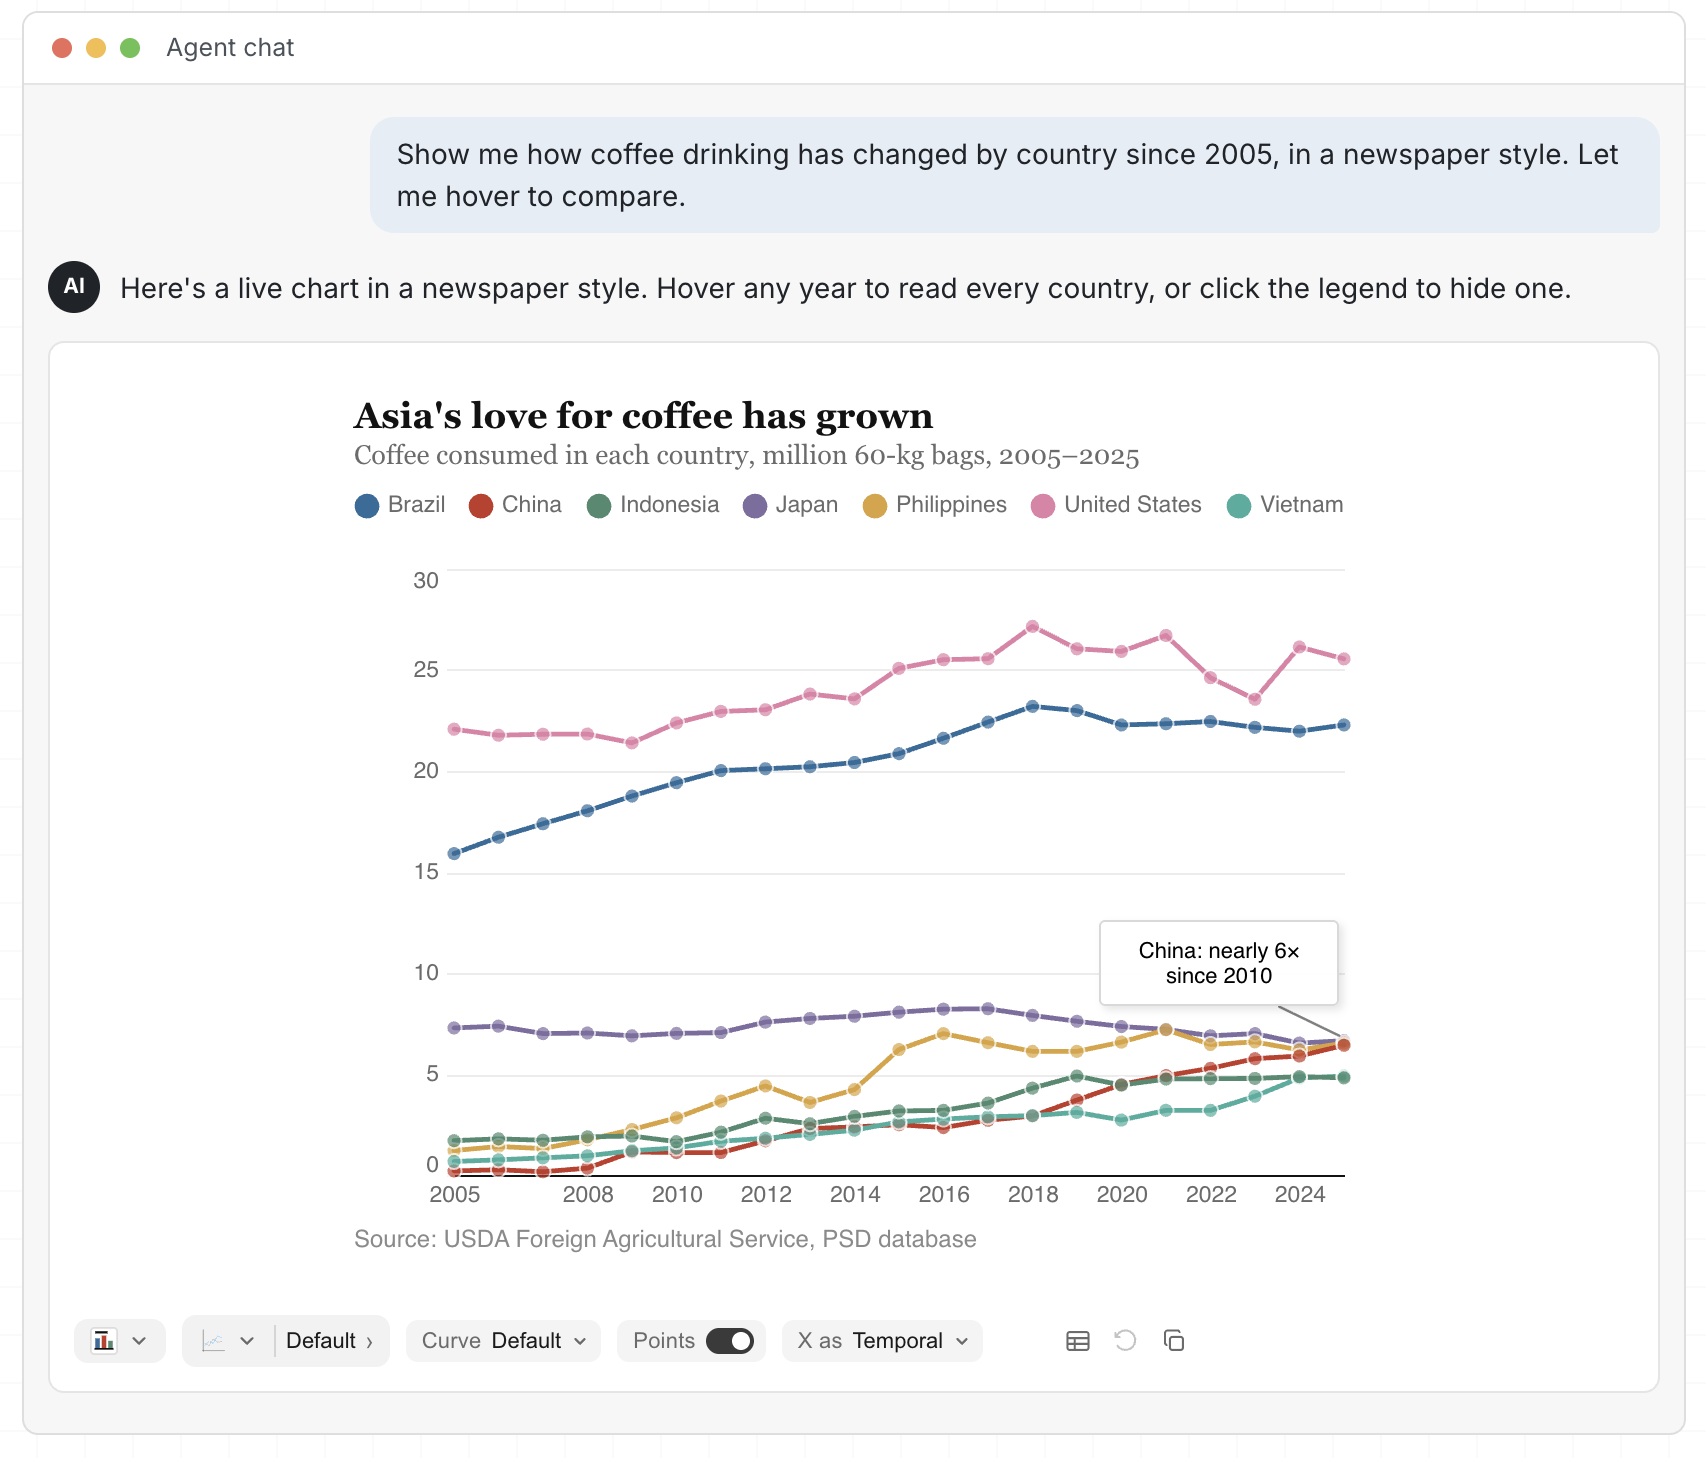
Brings rich interactivity to AI-generated charts: Flint-interactive enables agents to create data visualizations that users can explore directly through clicking, filtering, zooming, highlighting, and cross-chart interactions.
Makes complex interactions easier to build: Instead of requiring low-level visualization code, Flint-interactive lets users and agents define behaviors using high-level semantic events and update operators.
Improves reliability and reduces development effort: By using Flint’s compiler to handle interaction logic and visual dependencies, the system helps avoid many of the layout, rendering, and debugging challenges common in custom interactive visualizations.
Connects charts, text, tables, and applications: Flint-interactive supports interactive data stories, dashboards, and connected experiences where actions in one view can update charts, documents, widgets, or application state in another.
AI agents make it easy to analyze data and generate reports with data…