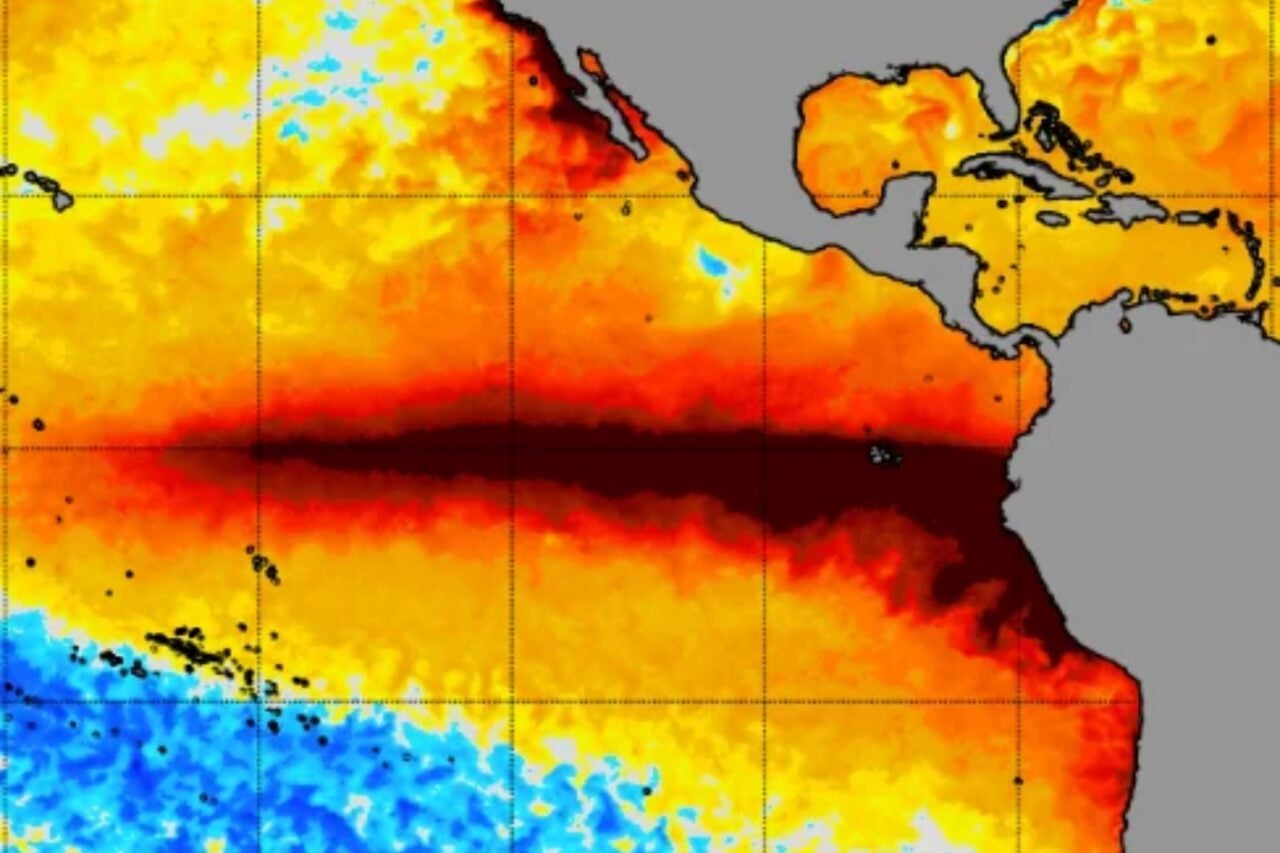
For months now, El Niño has been strengthening at breakneck speed. Climate scientists expect this event to reach a record-breaking peak sometime in December or January, so why are Pacific sea surface temperatures suddenly declining?
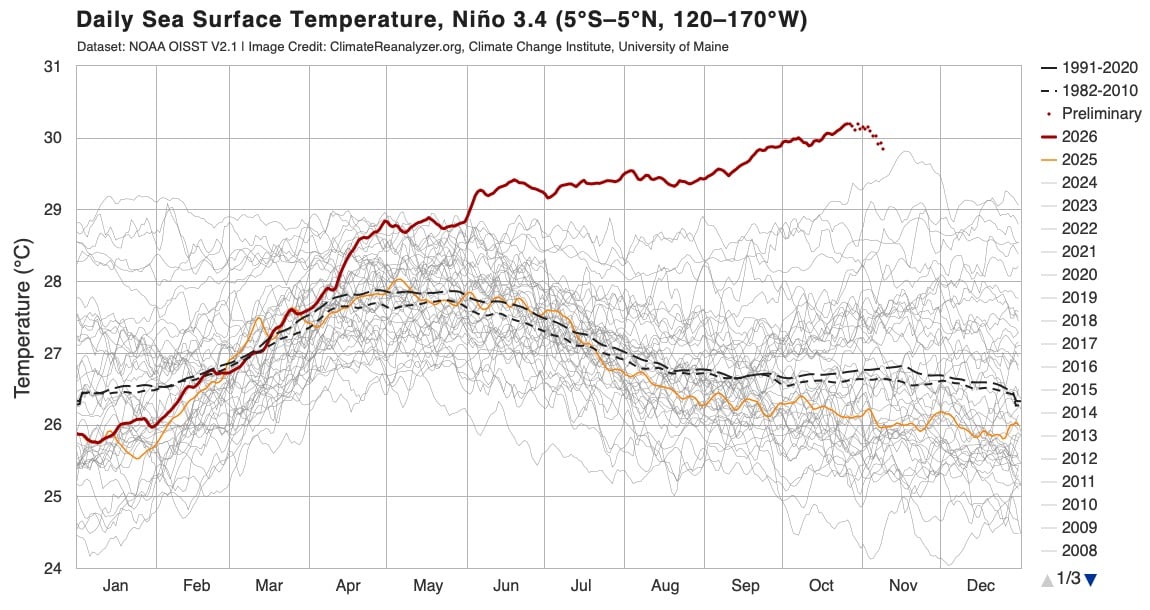
Take a look at this graph from the University of Maine’s Climate Change Institute. It charts daily average sea surface temperatures in the Niño 3.4 region, a key area of the central and eastern tropical Pacific that scientists monitor for El Niño and La Niña. That red line jutting out above all the rest is 2026, and as you can see, temperatures since June have been well above any observed in the last 45 years. That’s because of the current super El Niño.
This chart shows daily sea surface temperature in the Niño 3.4 region from NOAA OISST V2.1. Preliminary estimates for the past two weeks are plotted as dots. Image credit: Climate Change Institute, University of Maine.…