Python developers have had access to a code profiler for a long time. cProfile ships with Python, records every function call and tells you exactly how often each function ran. That makes it useful for scripts and batch jobs whose execution you control.
It’s less convenient for situations you can’t control. For example, when a web service is already running and starts behaving badly. You can’t just attach cProfile to that running process to see what’s going on. Restarting the service under a profiler may make the problem disappear, and the tracing overhead can change the behaviour you’re trying to measure in any case.
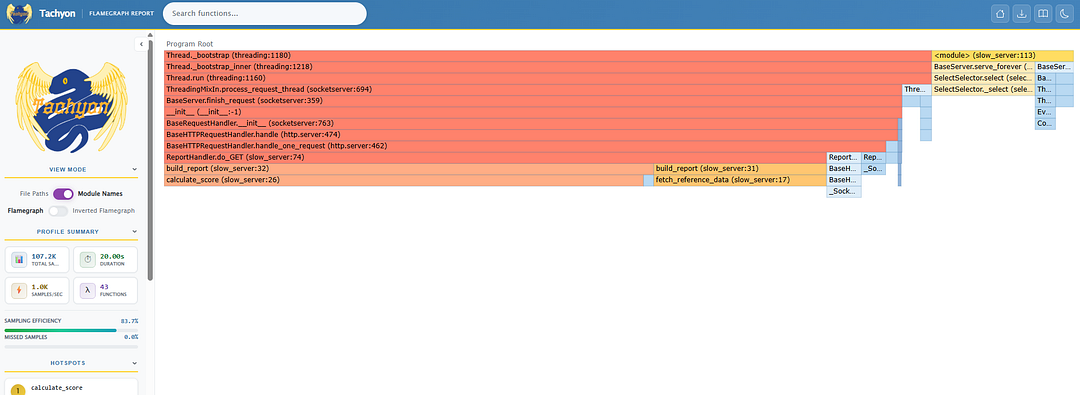
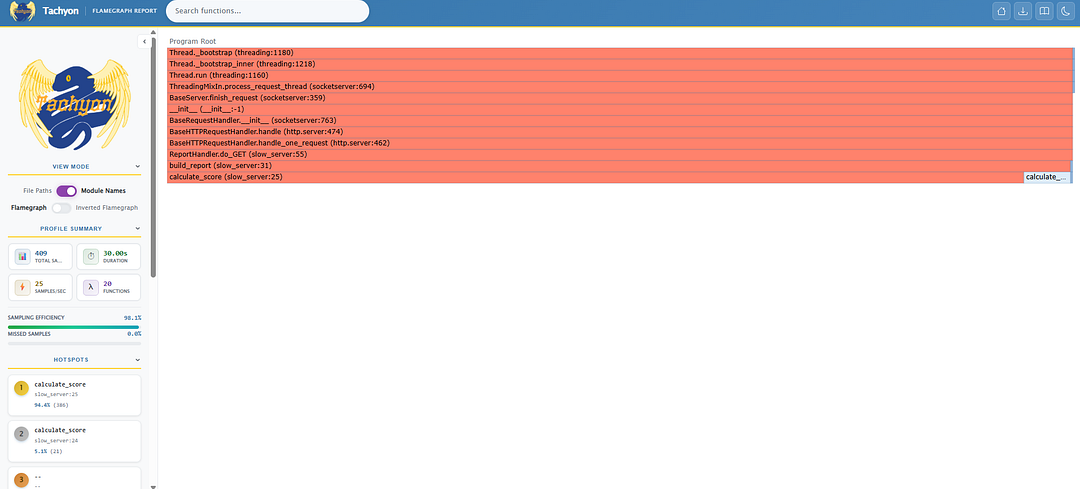
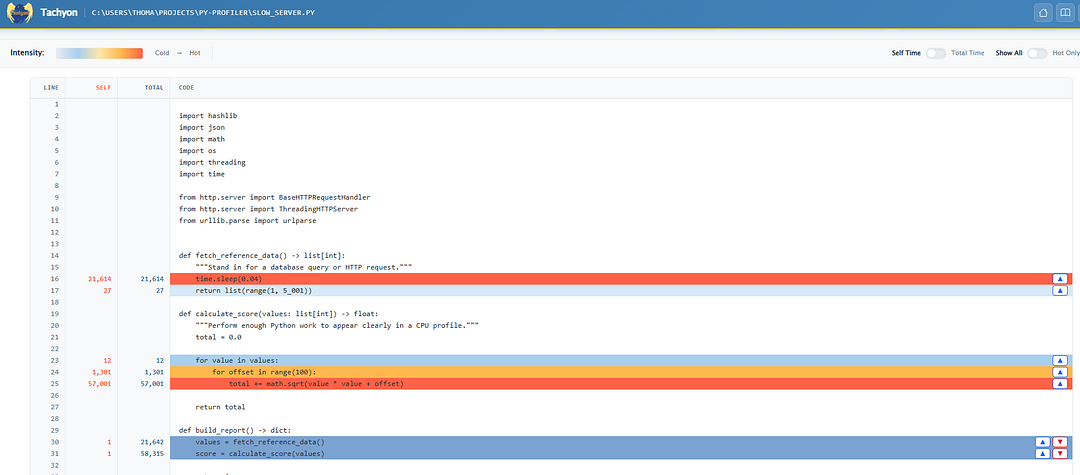
Python 3.15 introduces another option. The new profiling.sampling module, known as Tachyon, can start a program itself or attach to a process that’s already running.…