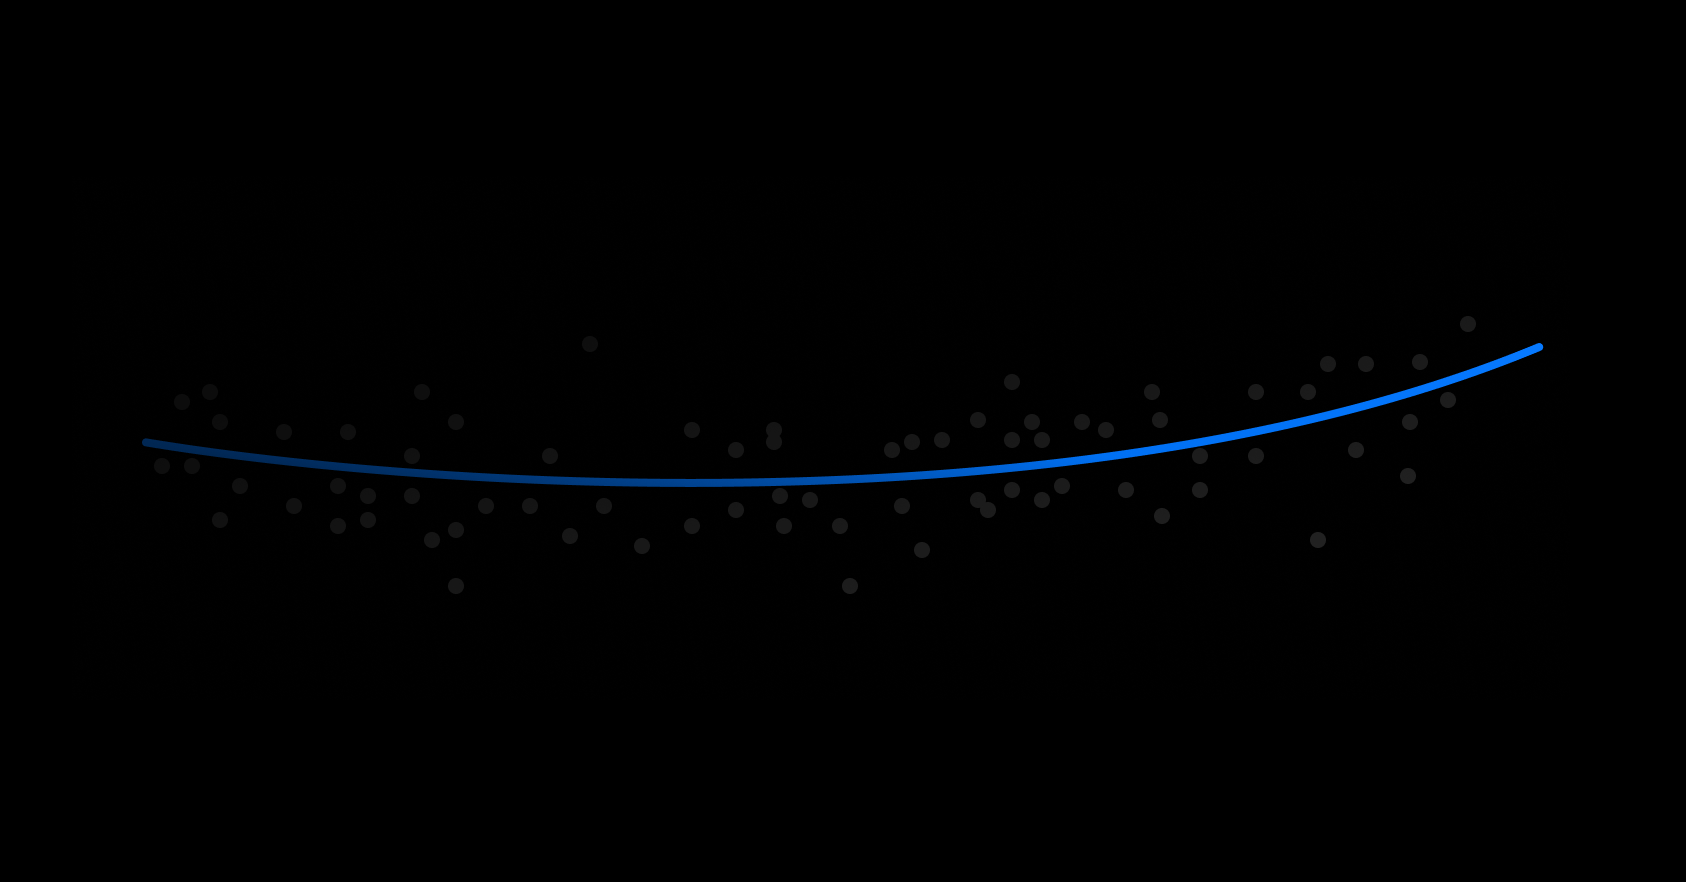
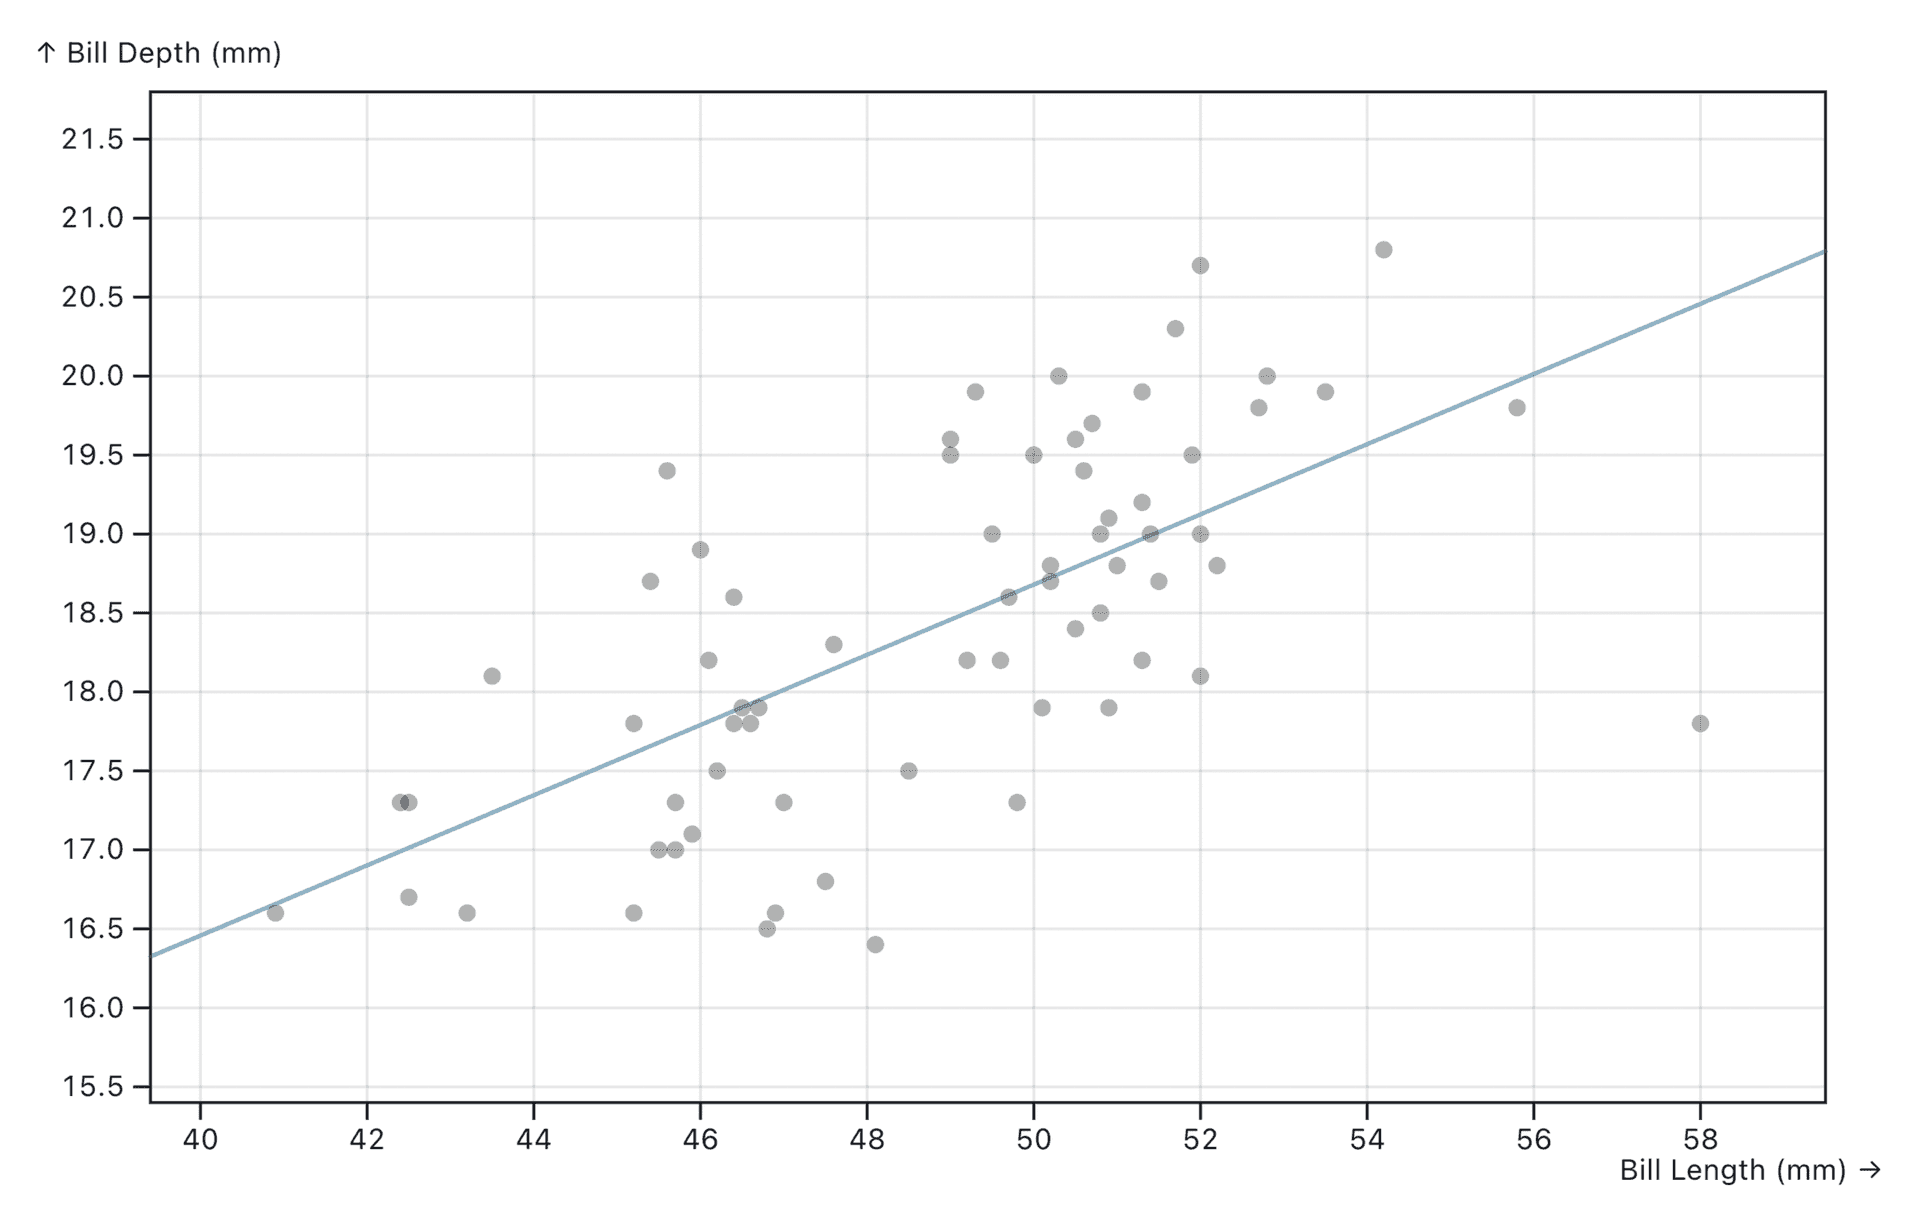
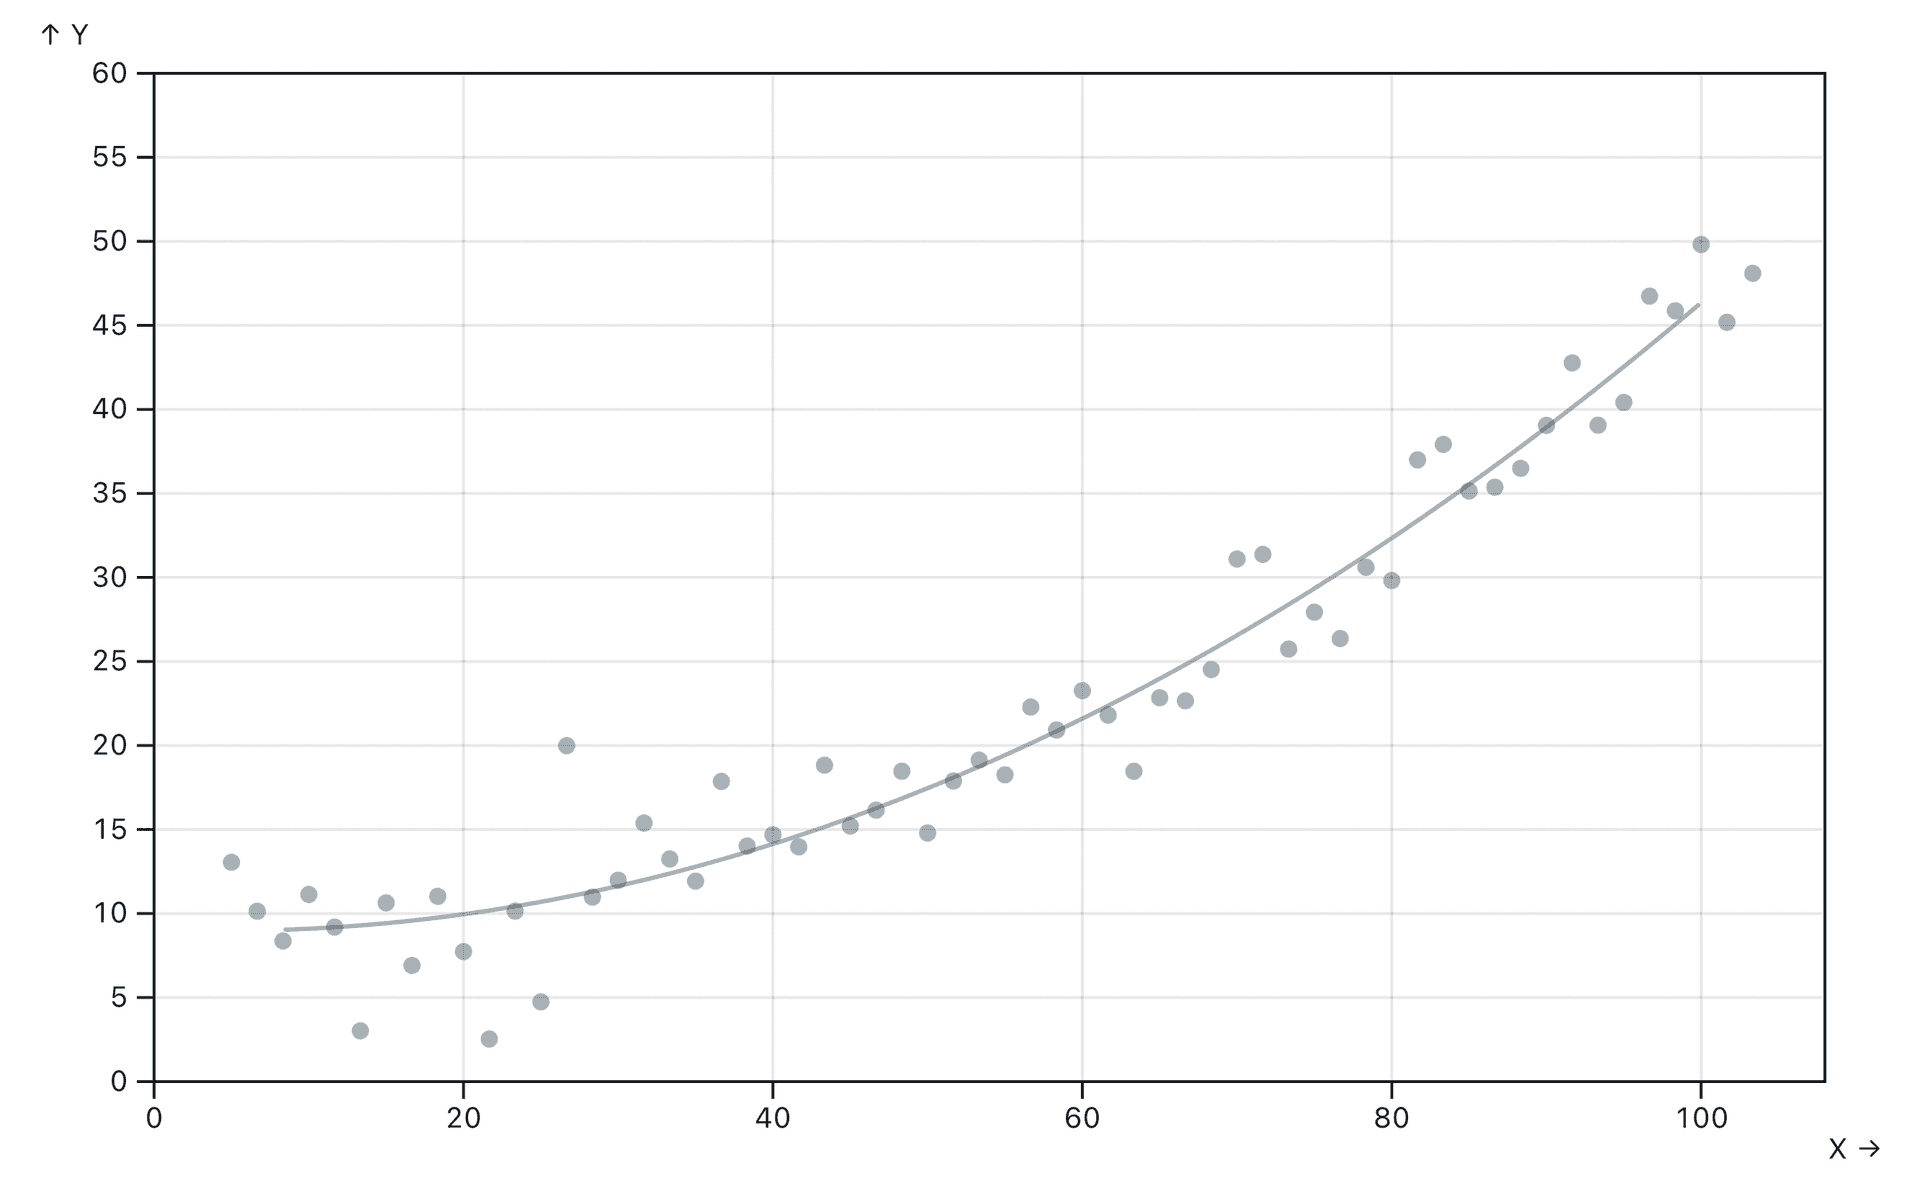
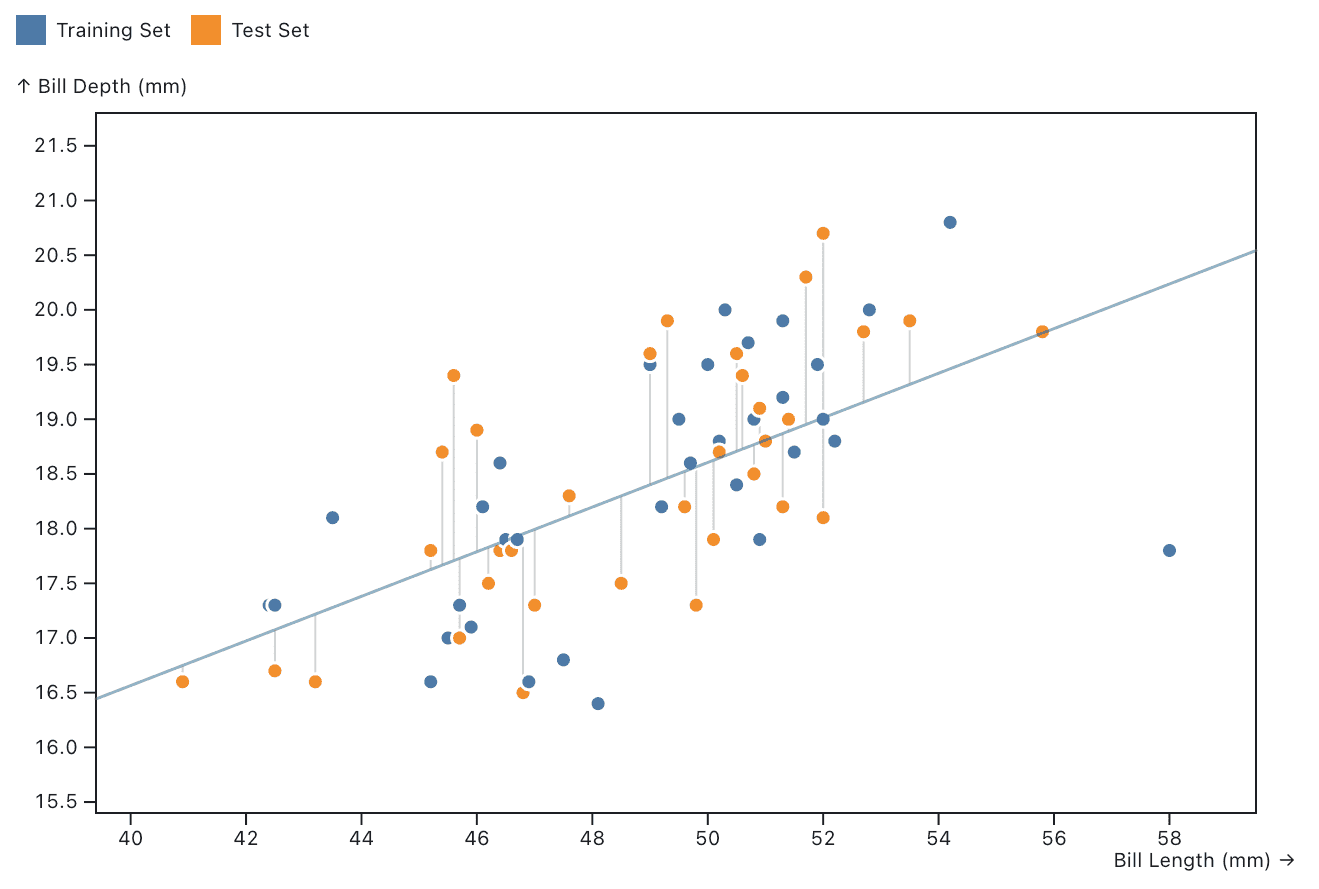
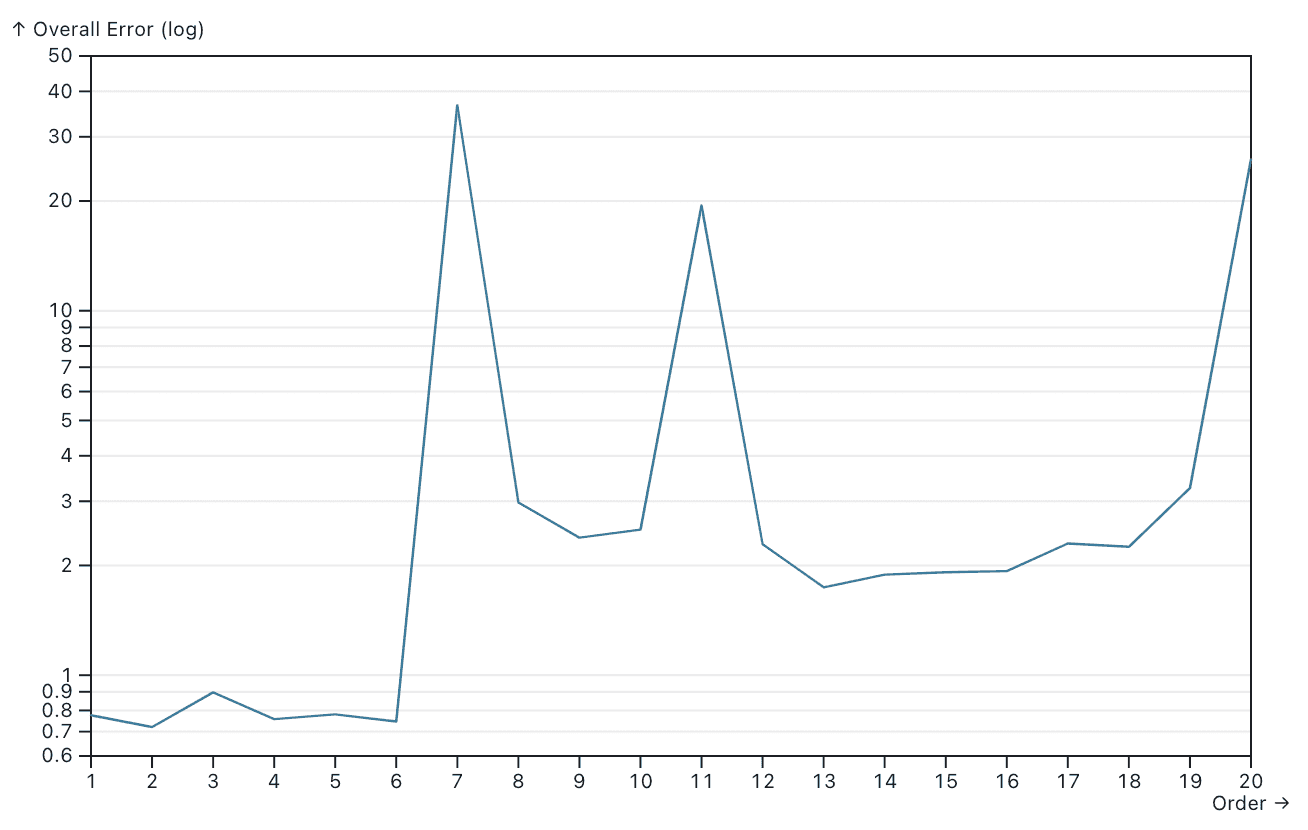
Last month, we released improved accuracy for Vercel Analytics charts —making it easier to visualize trends over time. This initially began as a side project I worked on during Vercel's Design Your Friday program (on the first Friday of every month, we work on a project of our choice). The goal: improving the data visualization of our Analytics charts.
Let's dig deep on this new change.
Link to heading Before and after
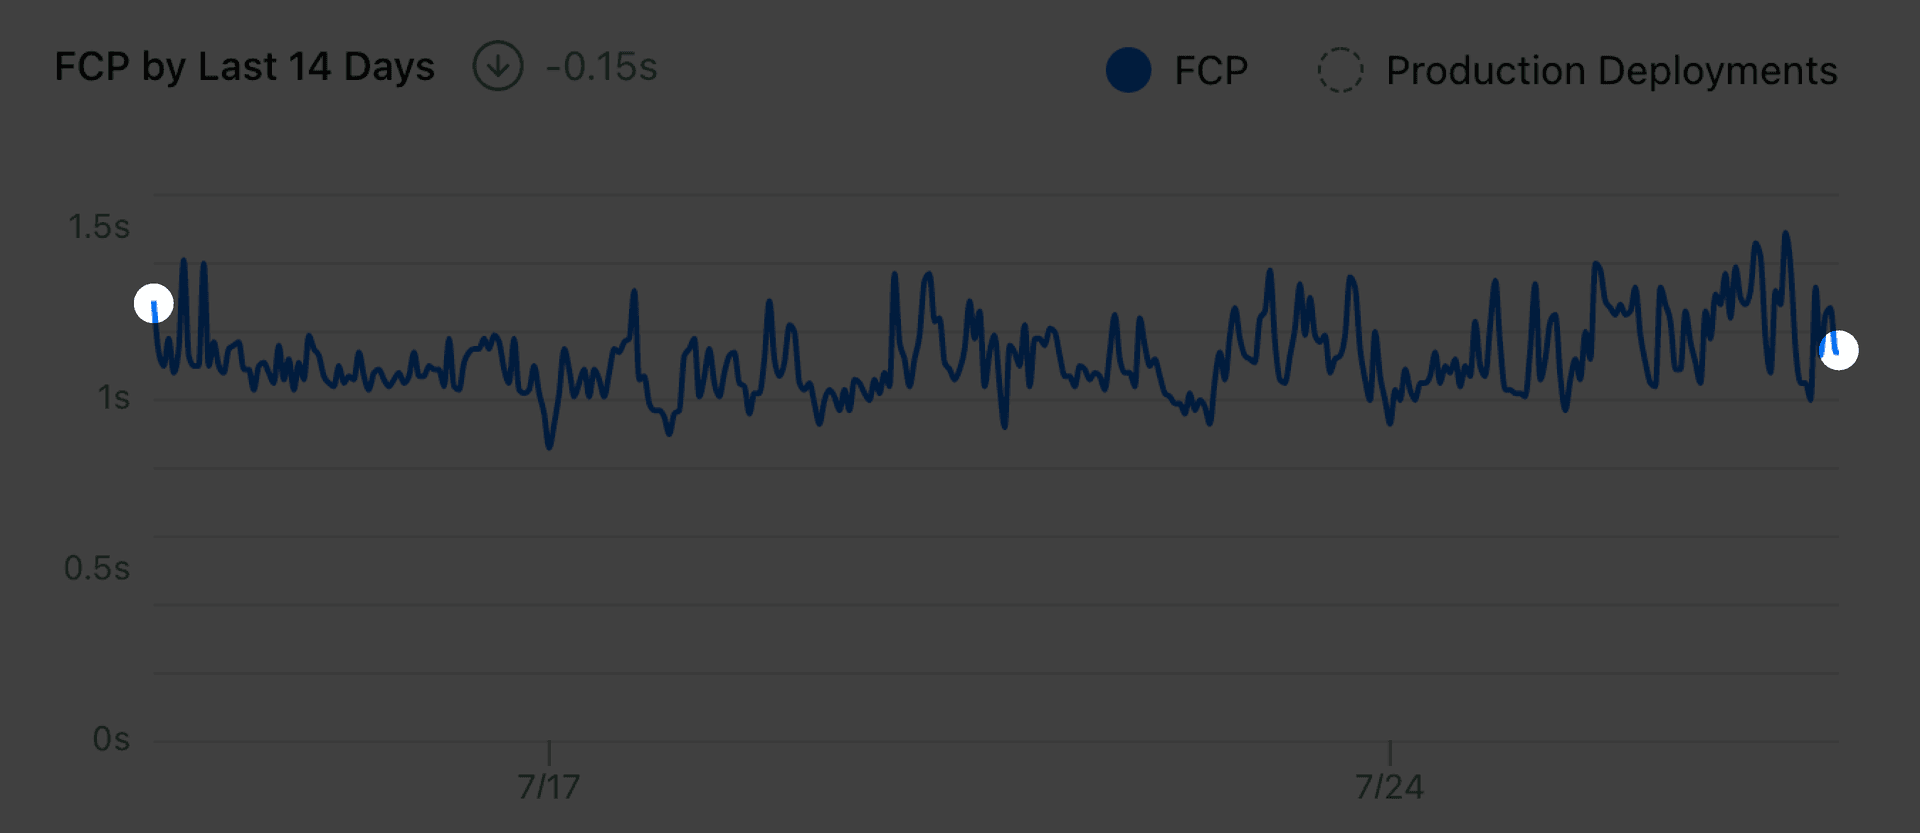
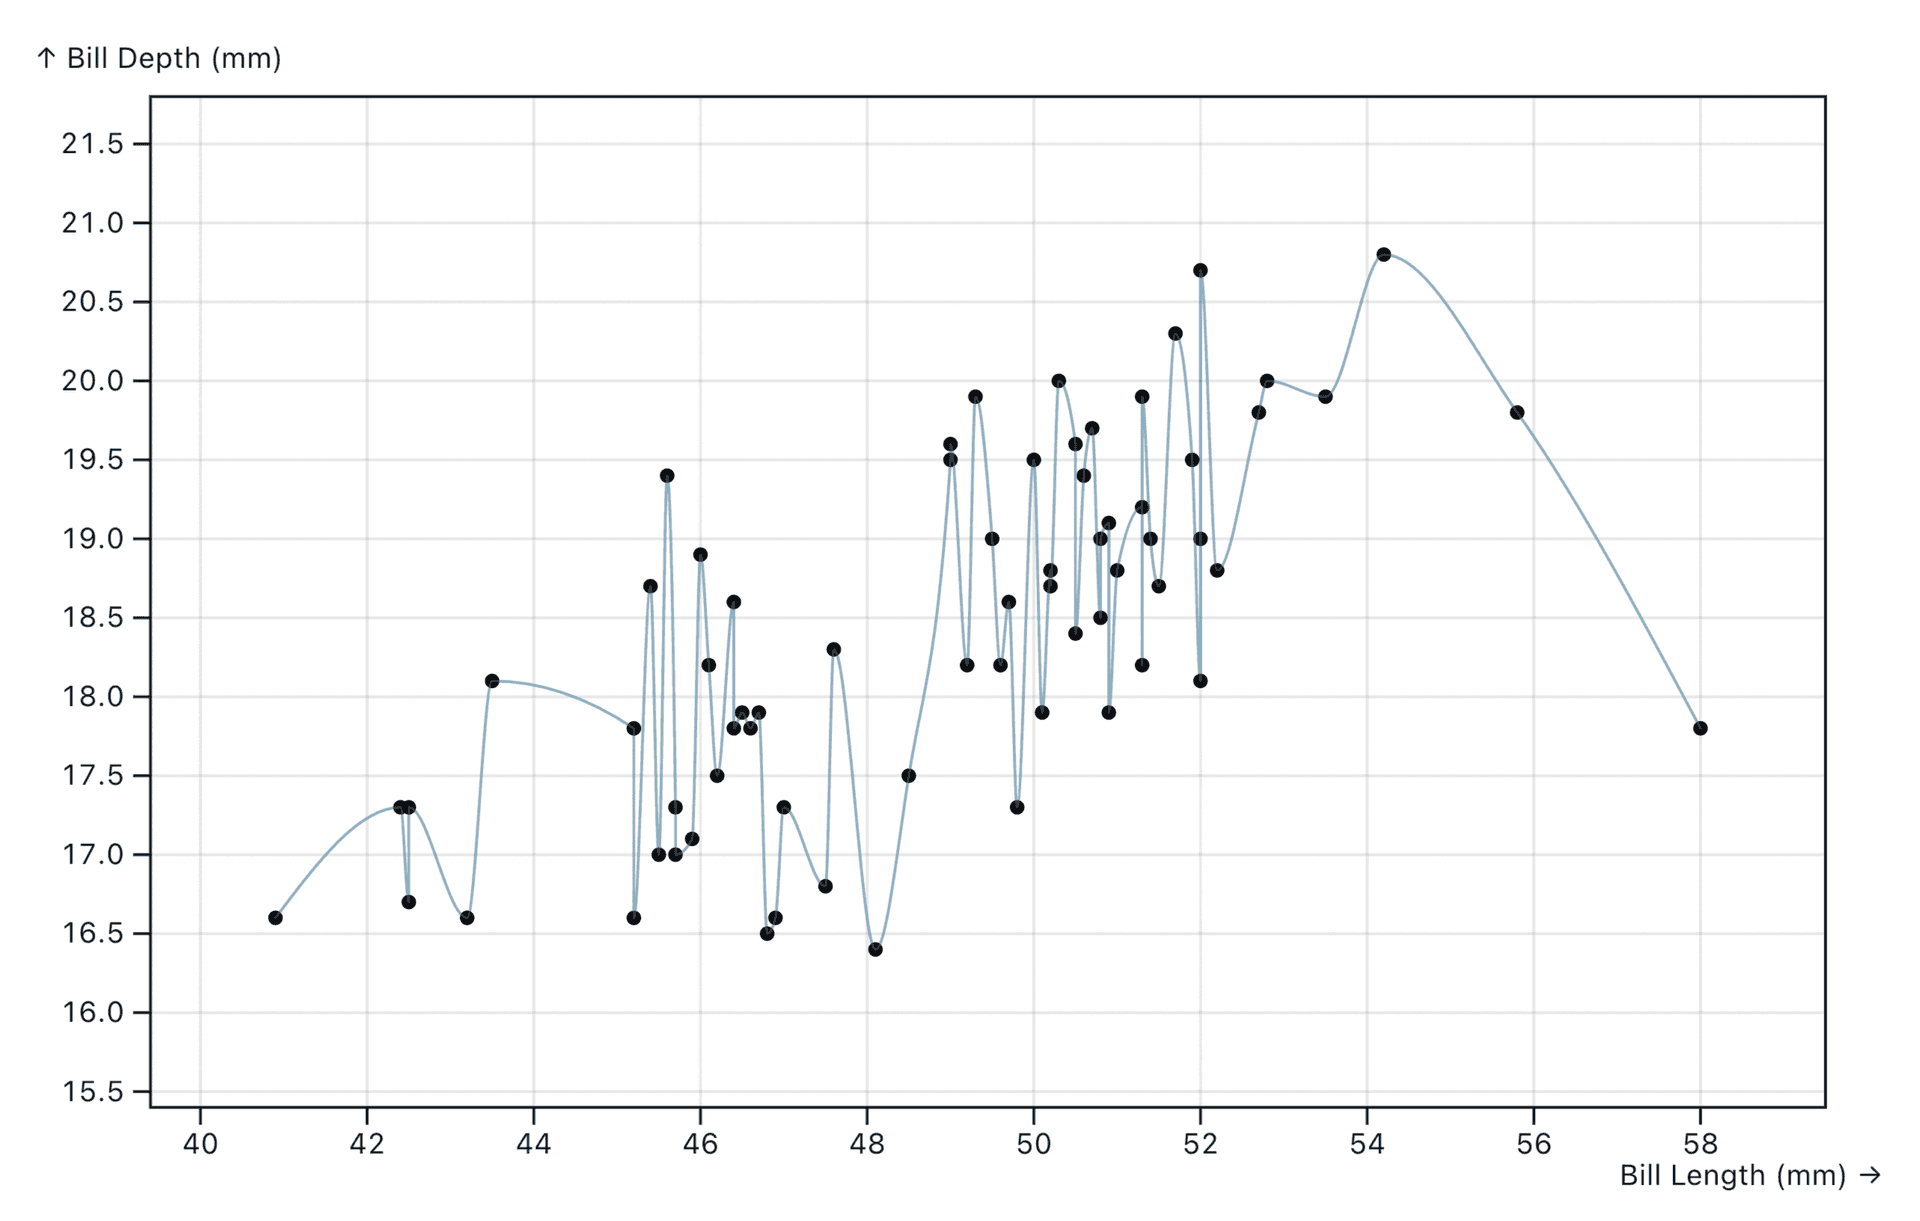
Previously, all the data points were visualized by simply connecting them as a line.
It’s hard to read the trend from that chart because it’s too noisy. And the delta showed a -0.15 decrease which felt wrong.…