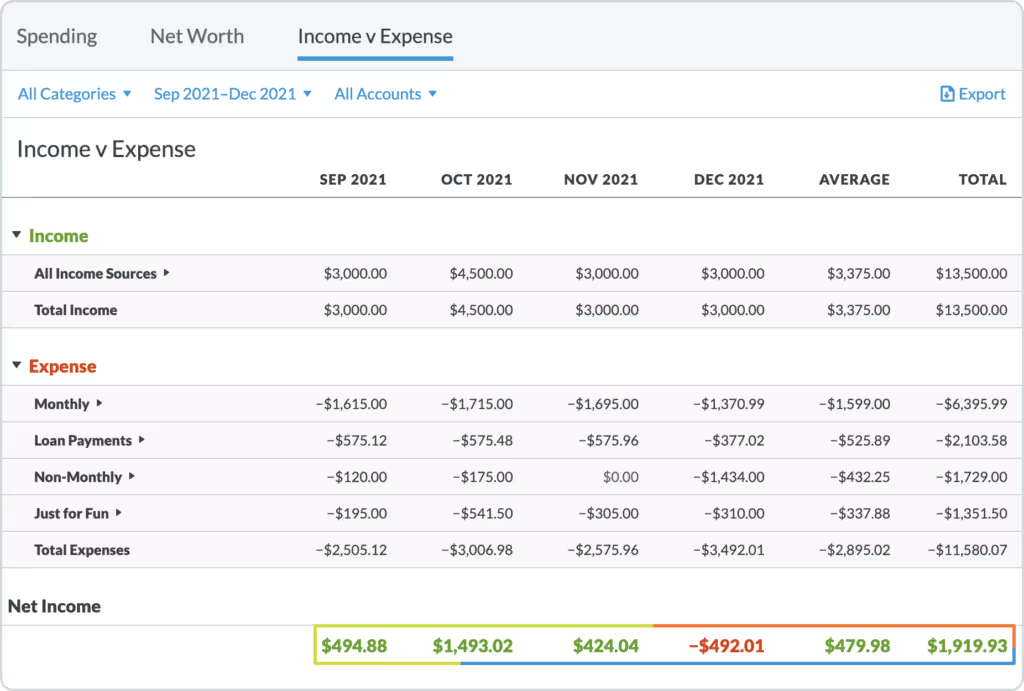
Budget reports! Budget reports! Long live, budget reports!
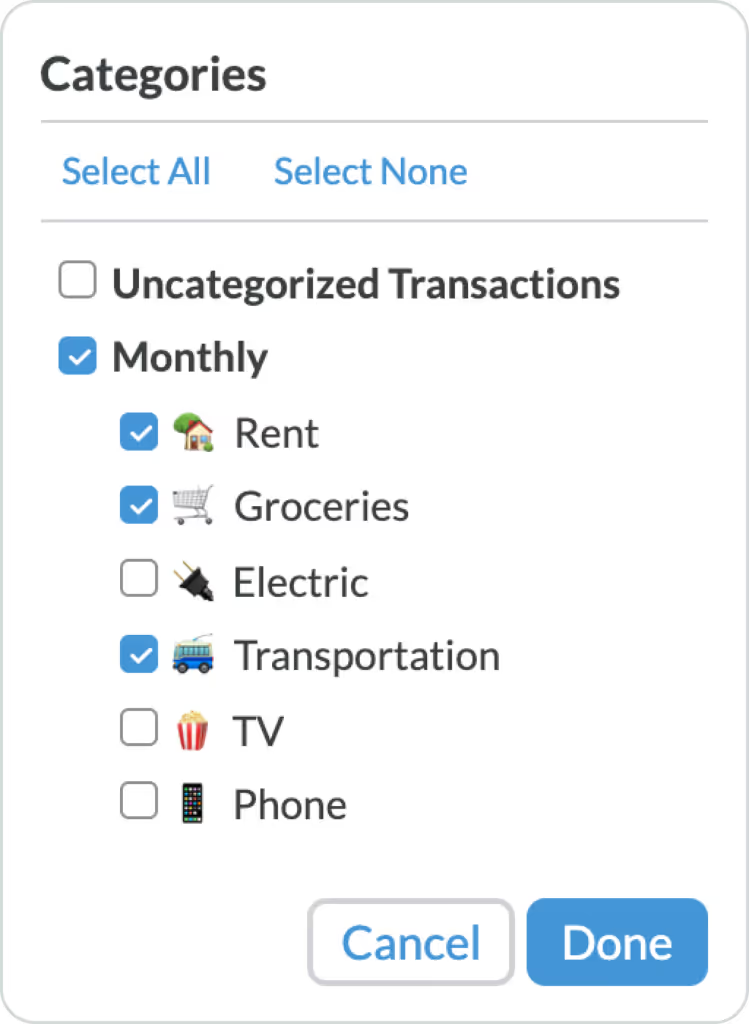
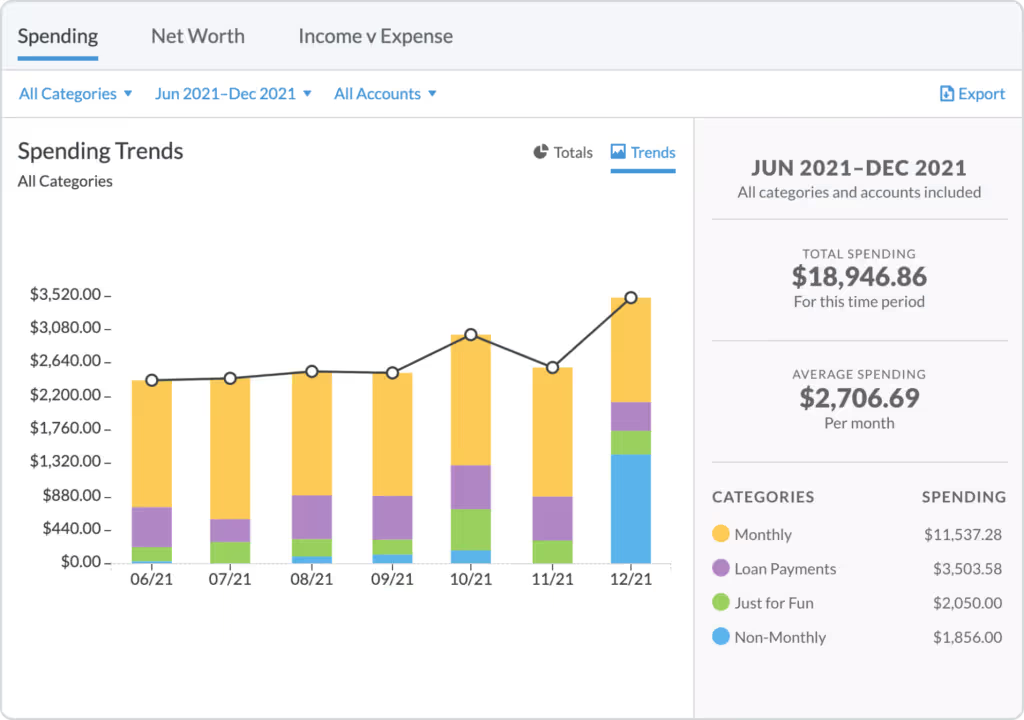
You want to slice and dice your financial data every which way? Check.
You want a high-level view of how you’re doing? Done.
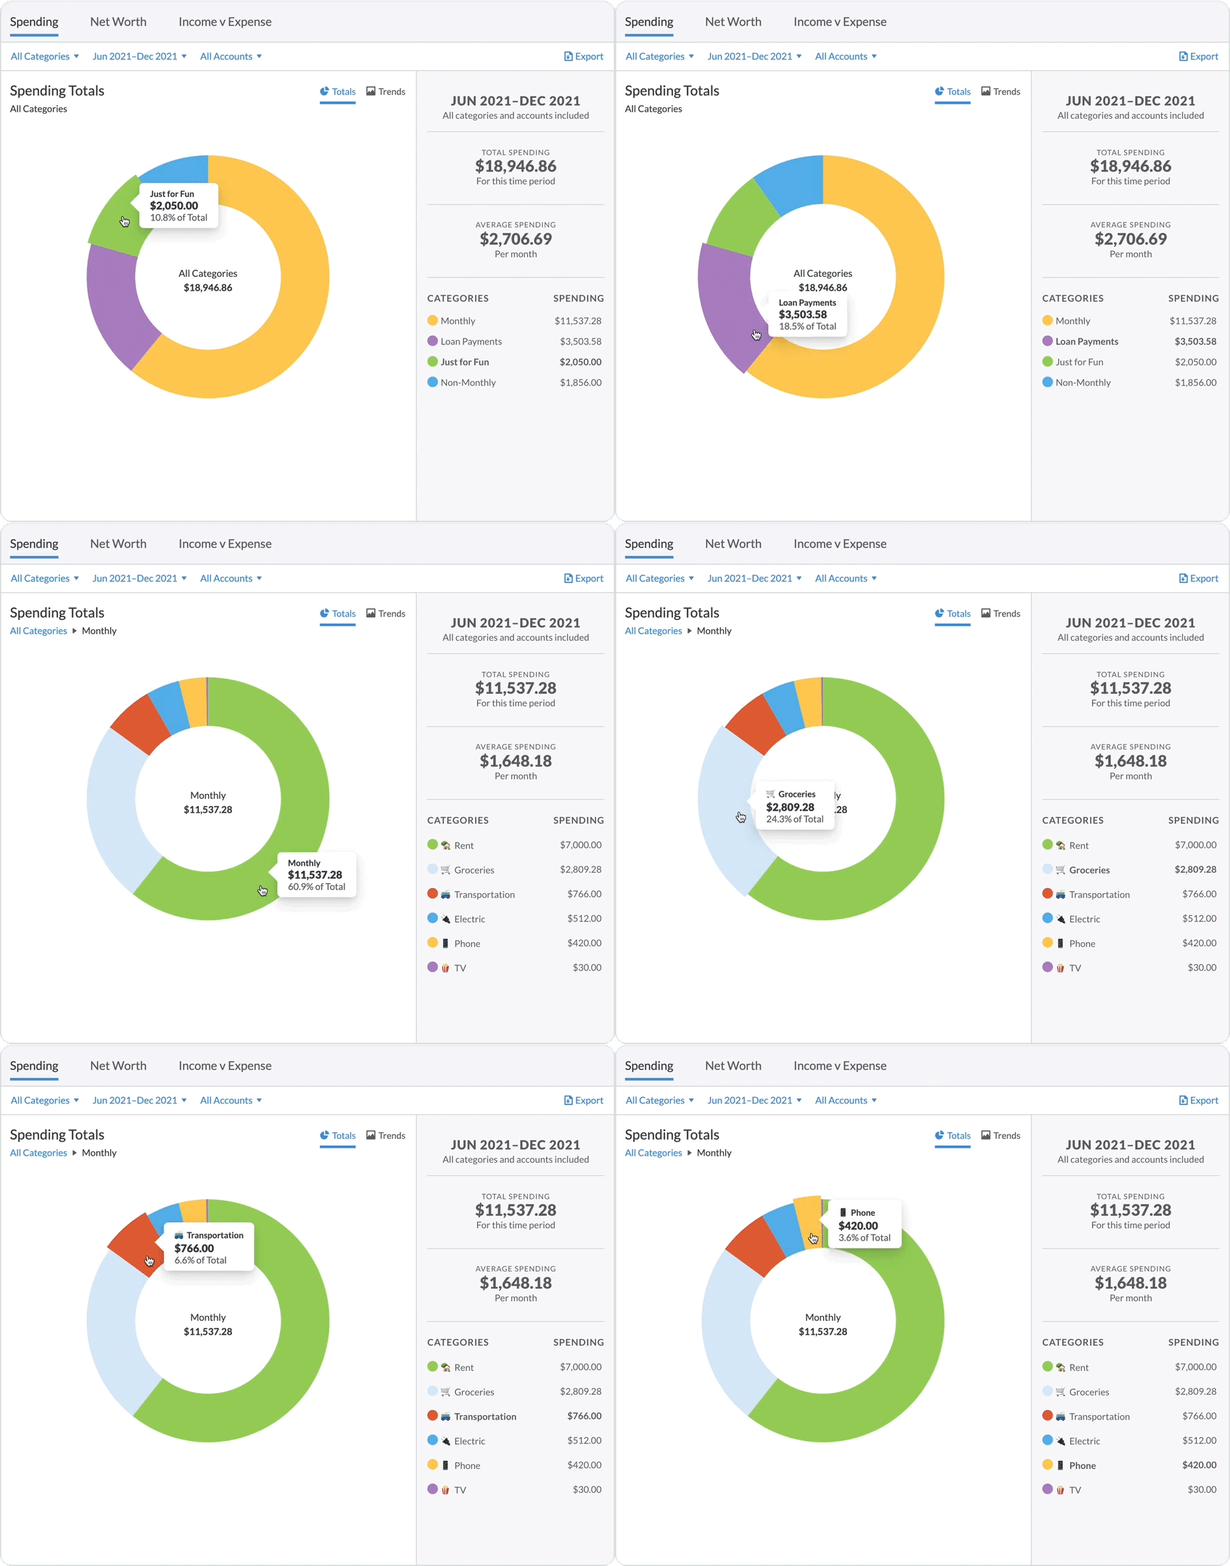
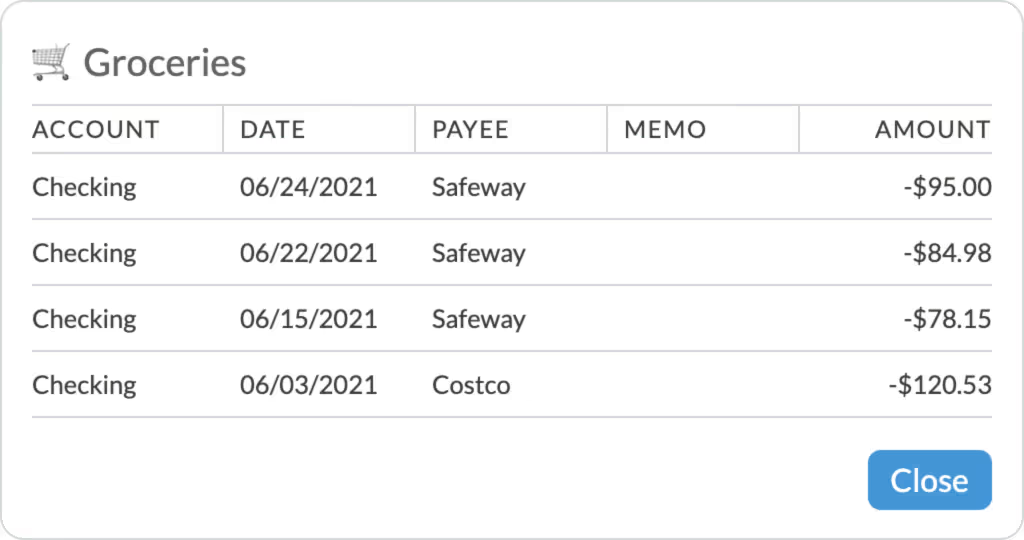
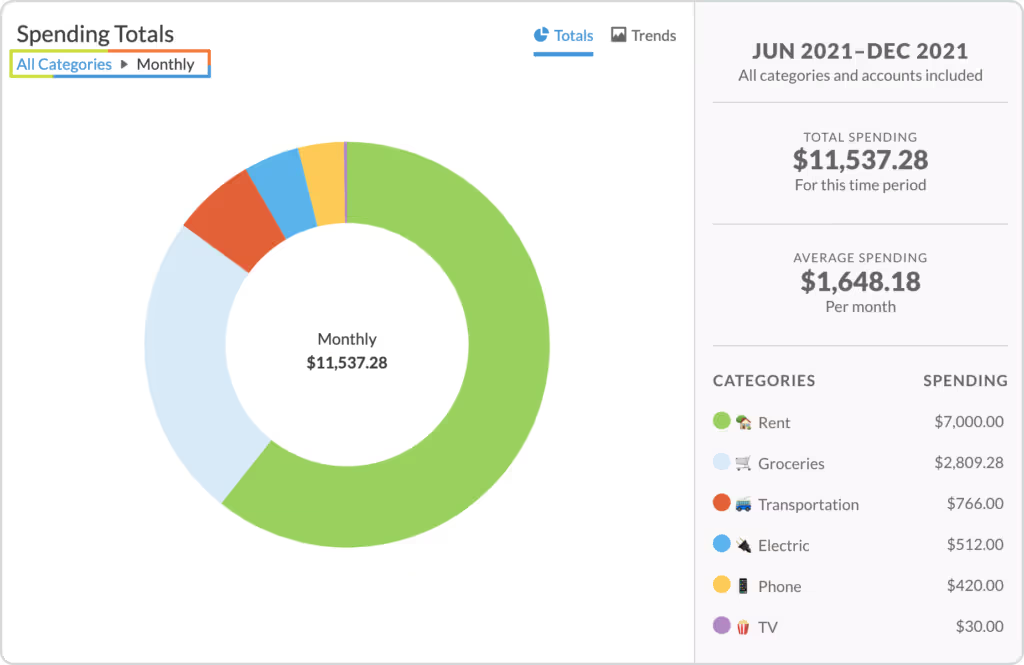
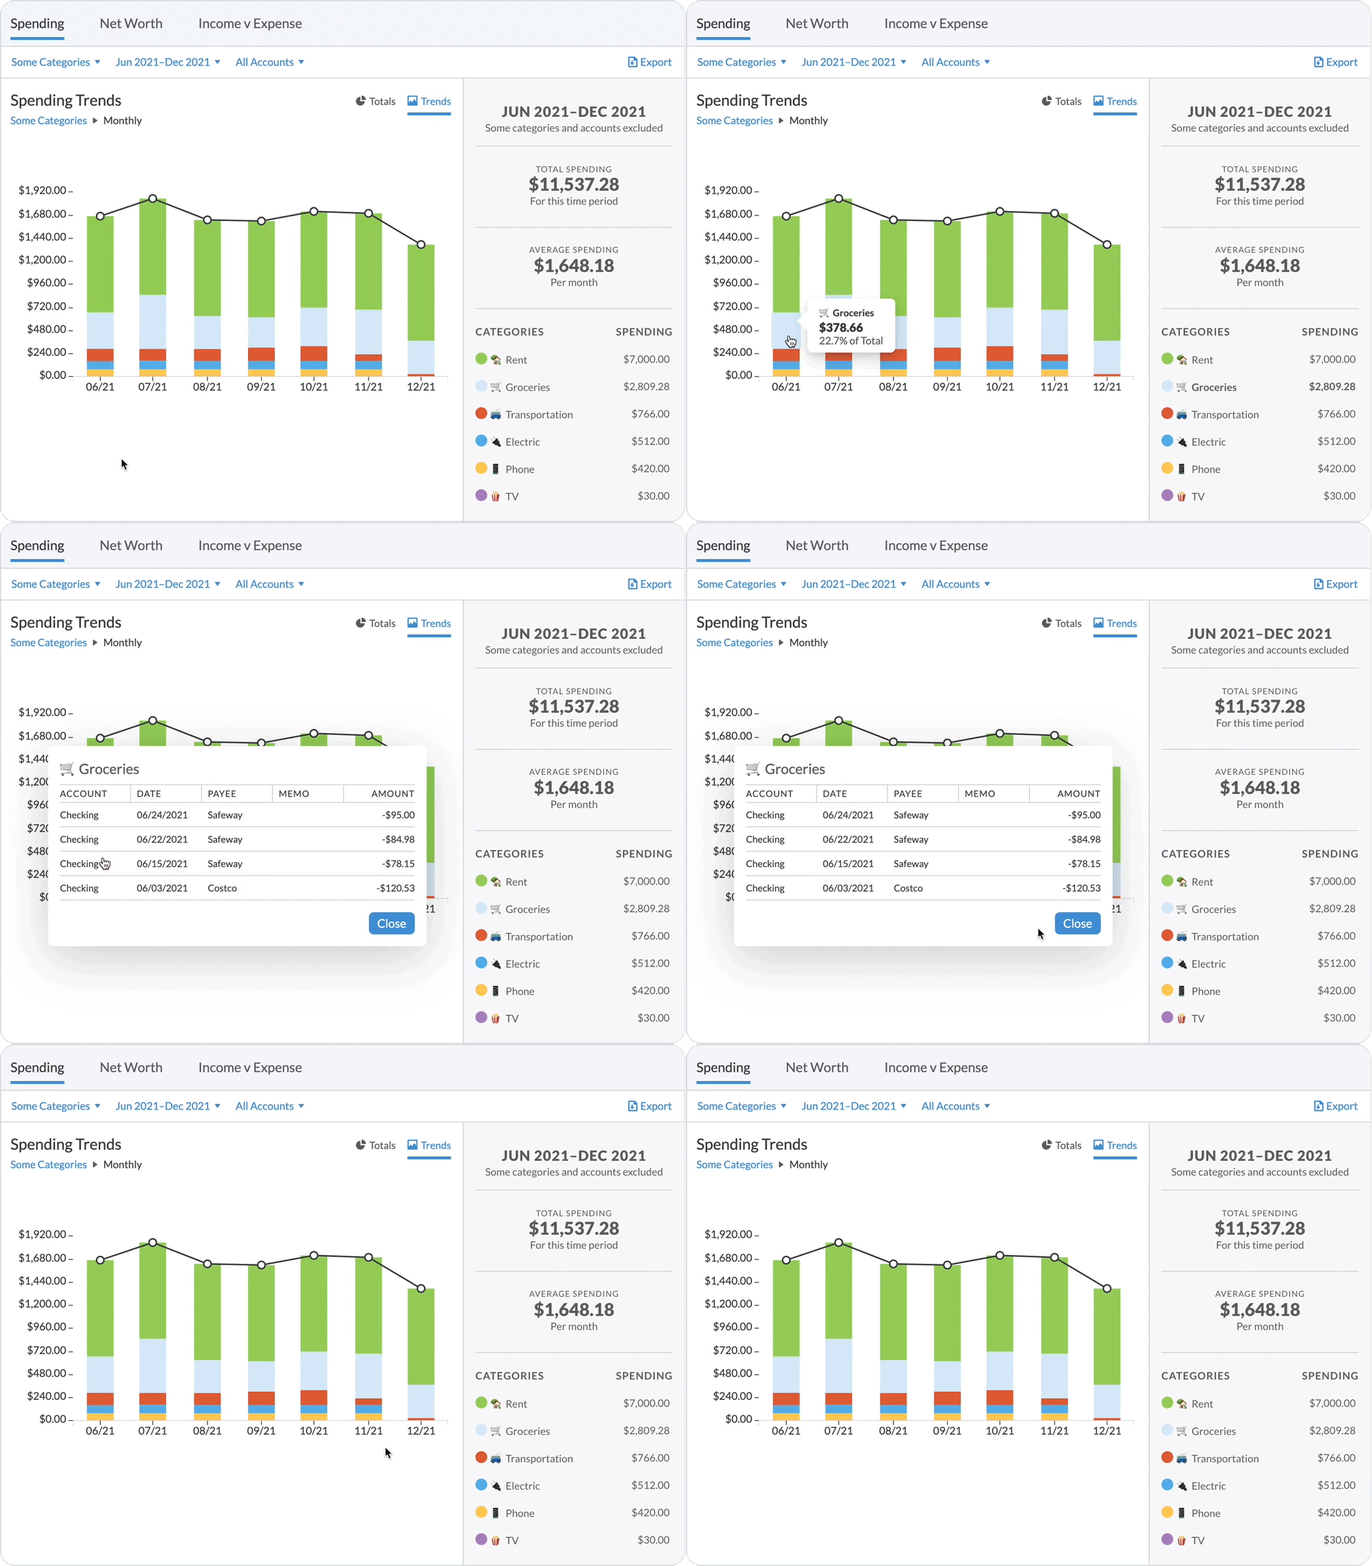
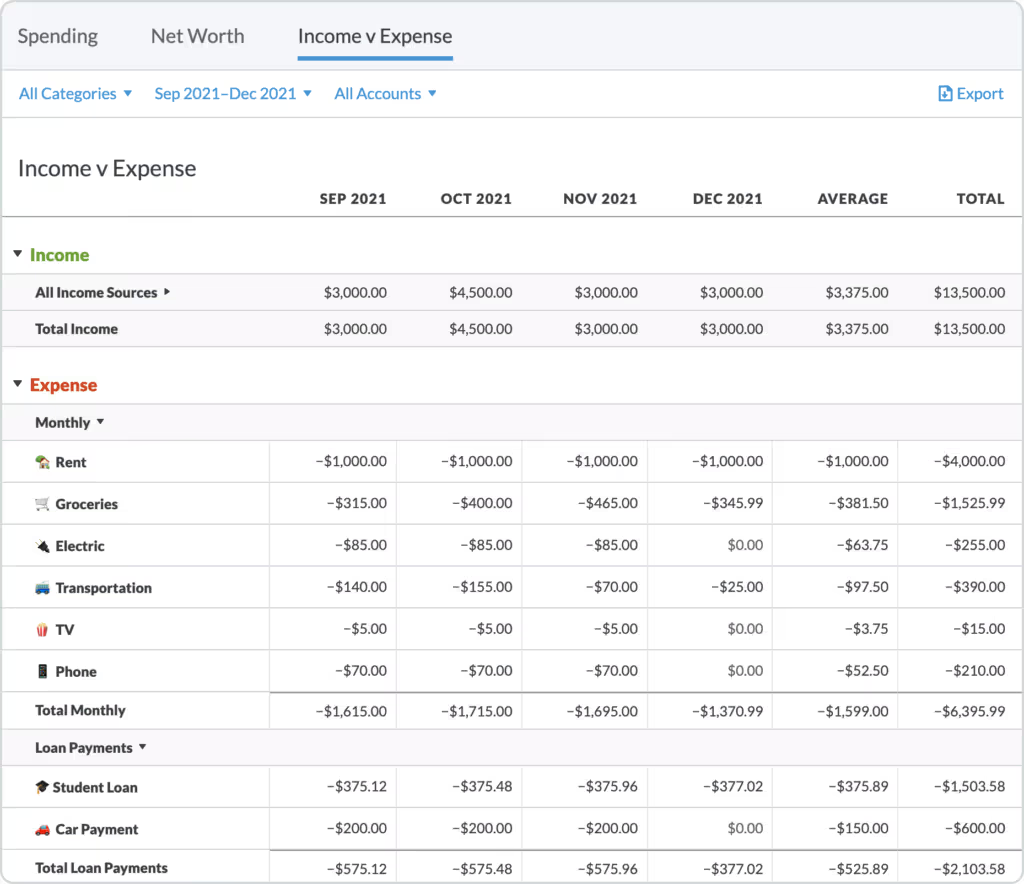
You want to get down to the nitty gritty details of a particular category? Woot!
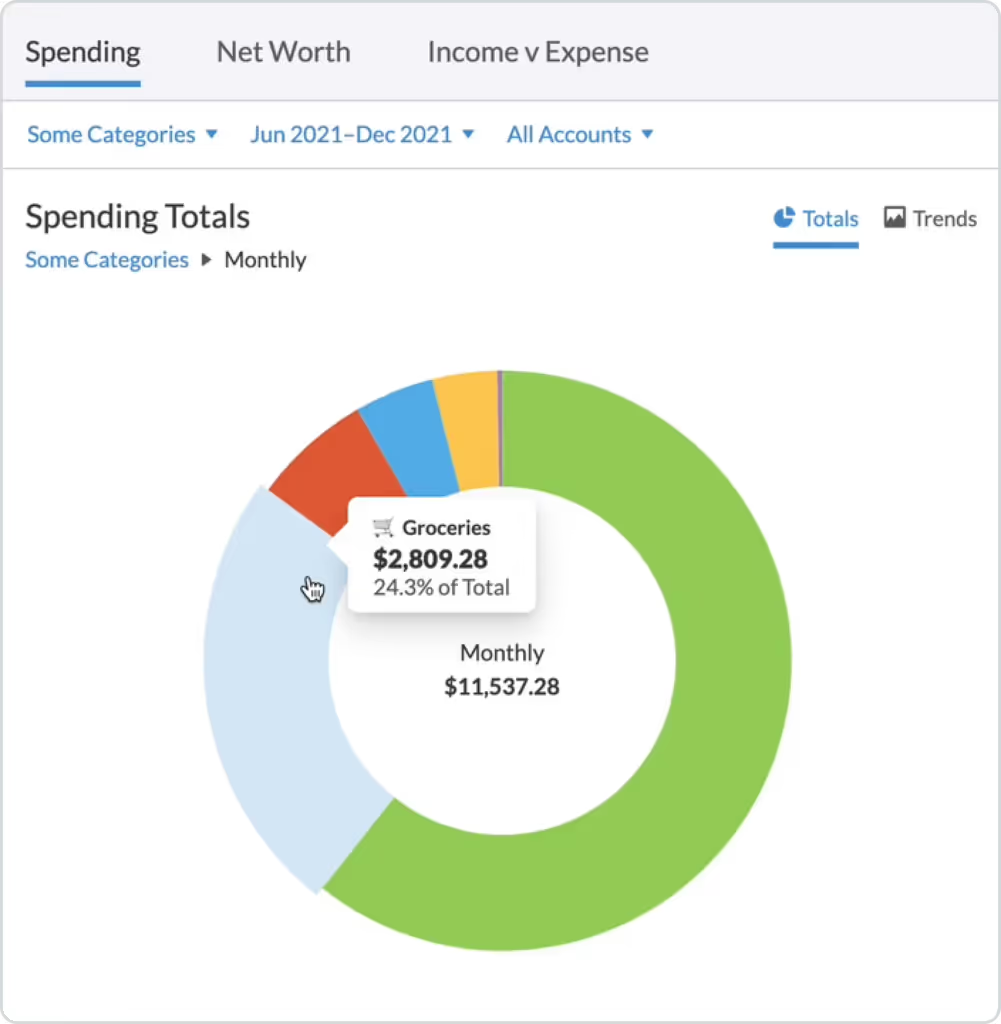
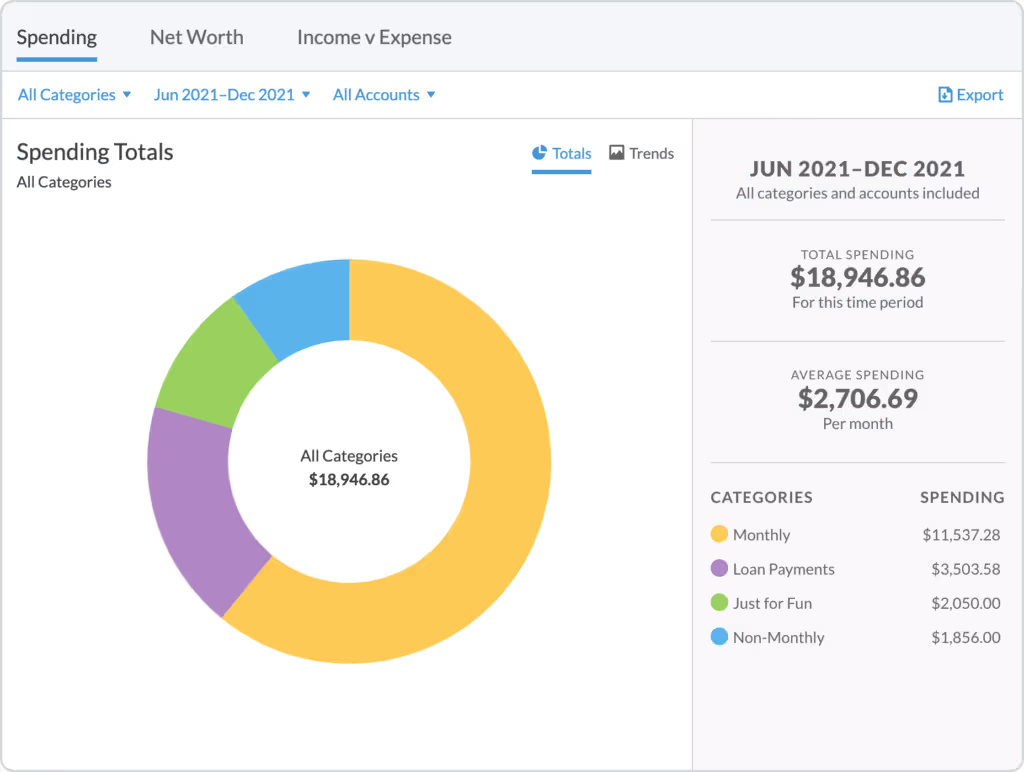
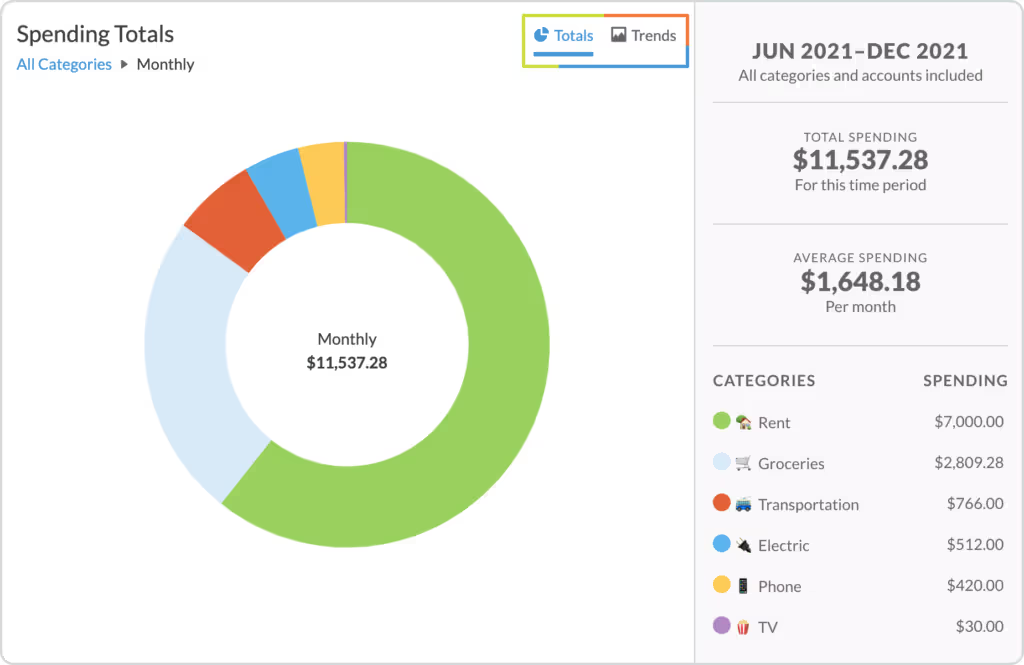
You want colorful graphs and pie charts? Bam. We’ve got you, fam.
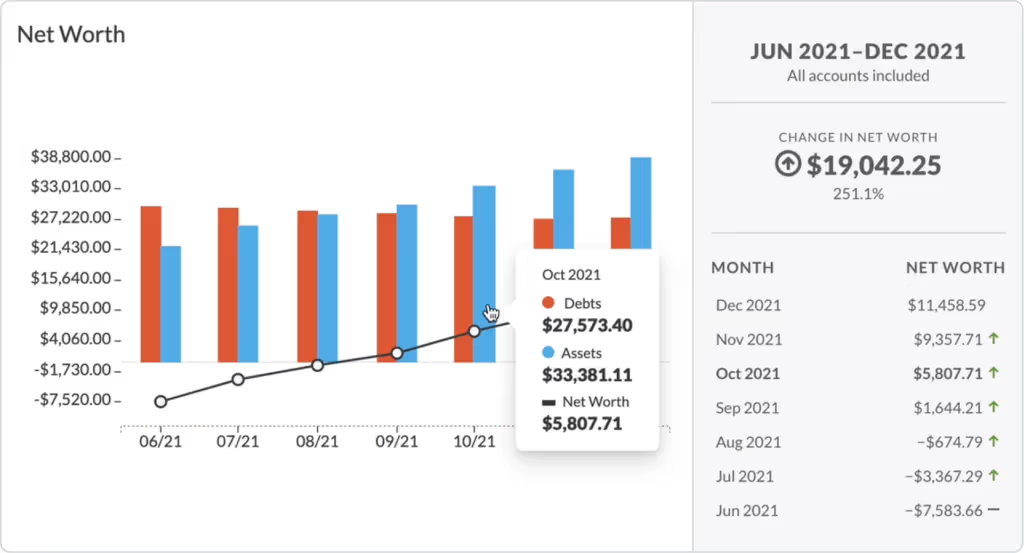
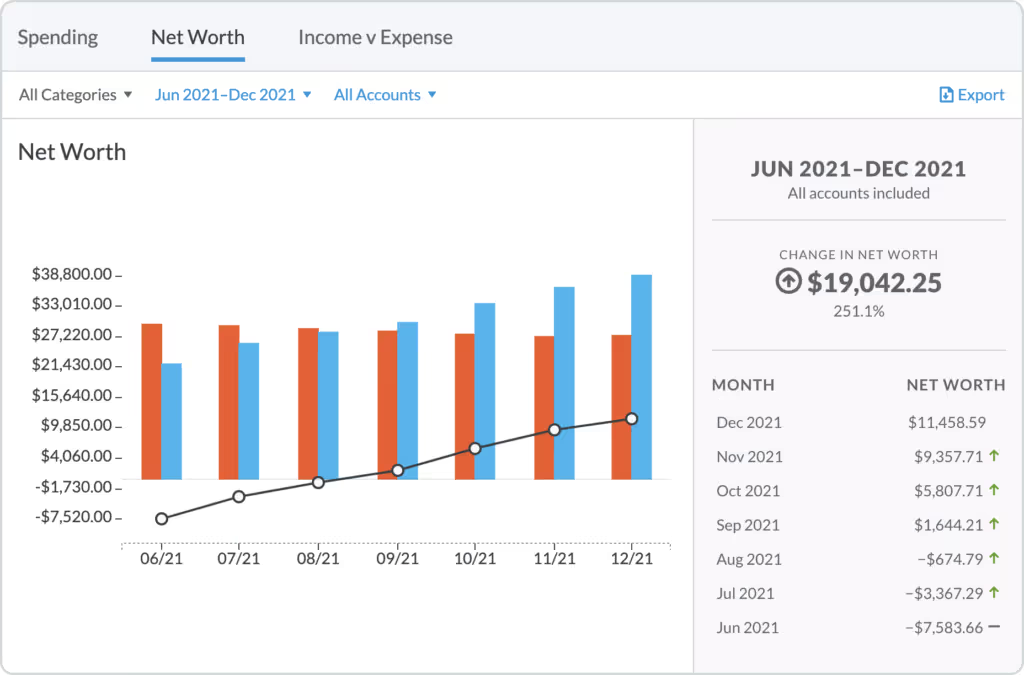
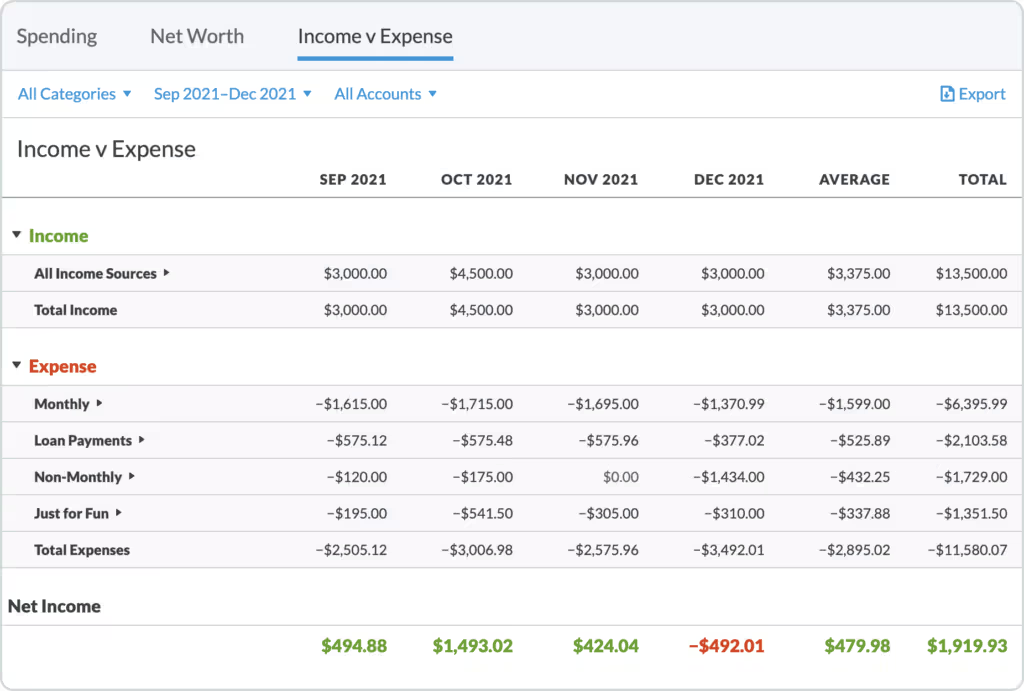
Data is an important part of personal finance, which is why the YNAB report functionality is an invaluable budgeting tool. You can track trends, check bank account balances, identify areas of overspending, and visualize your progress.
So, without further ado, here’s how to do all of that and more:
See Your Budget Reports in YNAB
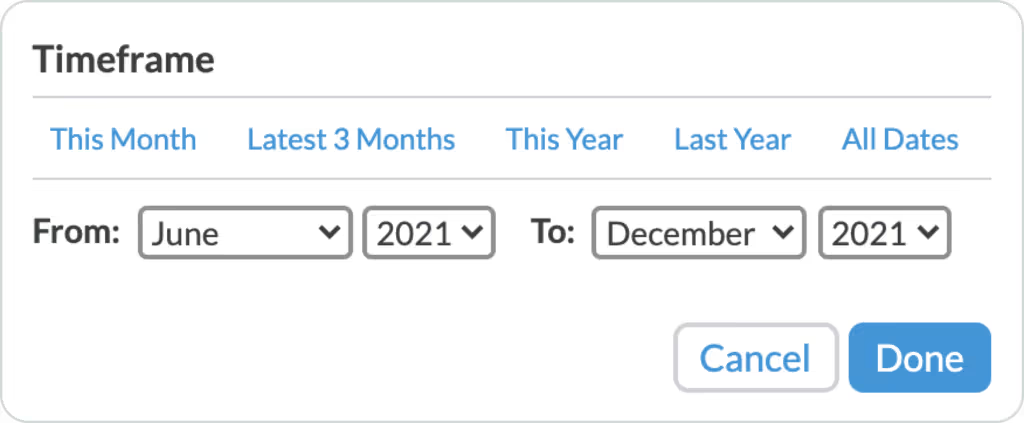
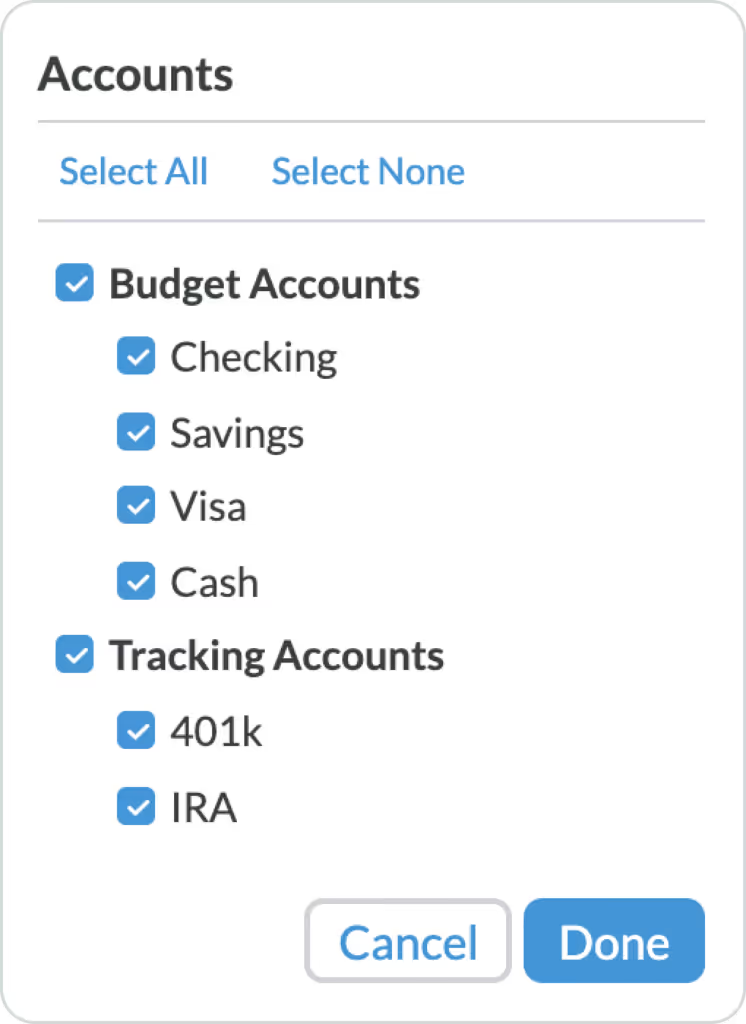
With budget reports, you’ll be able to isolate and focus on the data that is most important to you—and analyze your finances from several different vantage points.
In all three reports, you can filter by category groups, timeframe, and accounts.…