A spike at 7
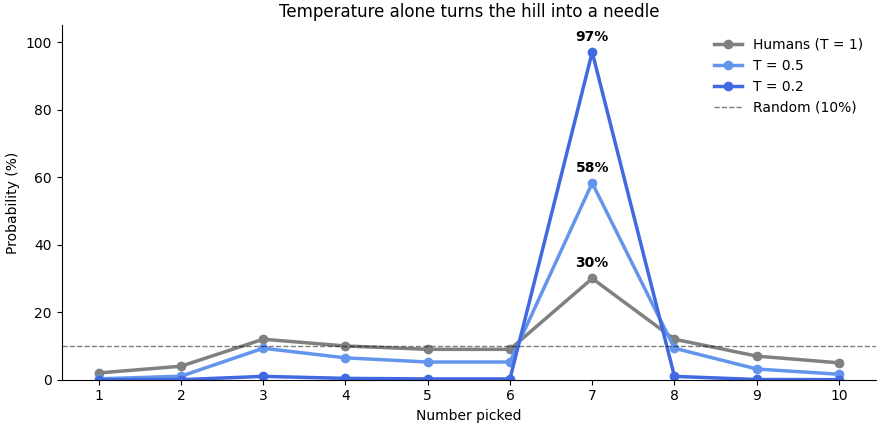
A chart has recently gone viral on X. It asks one simple question, "pick a number between 1 and 10", and compares three kinds of answers: a true random generator, humans, and a large language model. Random is a flat line at 10%, every number equally likely. Humans form a bumpy hill that peaks at 7. The LLM is a single needle at 7, as if it had never heard of any other number.
The author's caption: this is the least surprising graph in the world if you understand how gradient descent works. It's half right, which is the most dangerous way to be right.
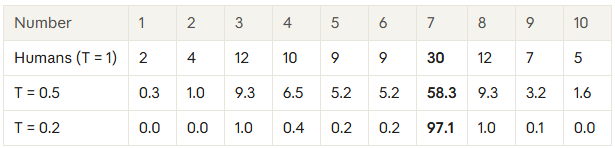
The short version: gradient descent decides where the peak is, not how sharp it is. Pretraining copies humans, and humans love 7, so the peak lands on 7, but as a gentle hill like the human one. The needle comes later, from post-training and from the way we sample answers. The rest of this piece walks through both.
A small note before we start: the chart is an artist's impression. No y-axis, no sample size, no uncertainty.…