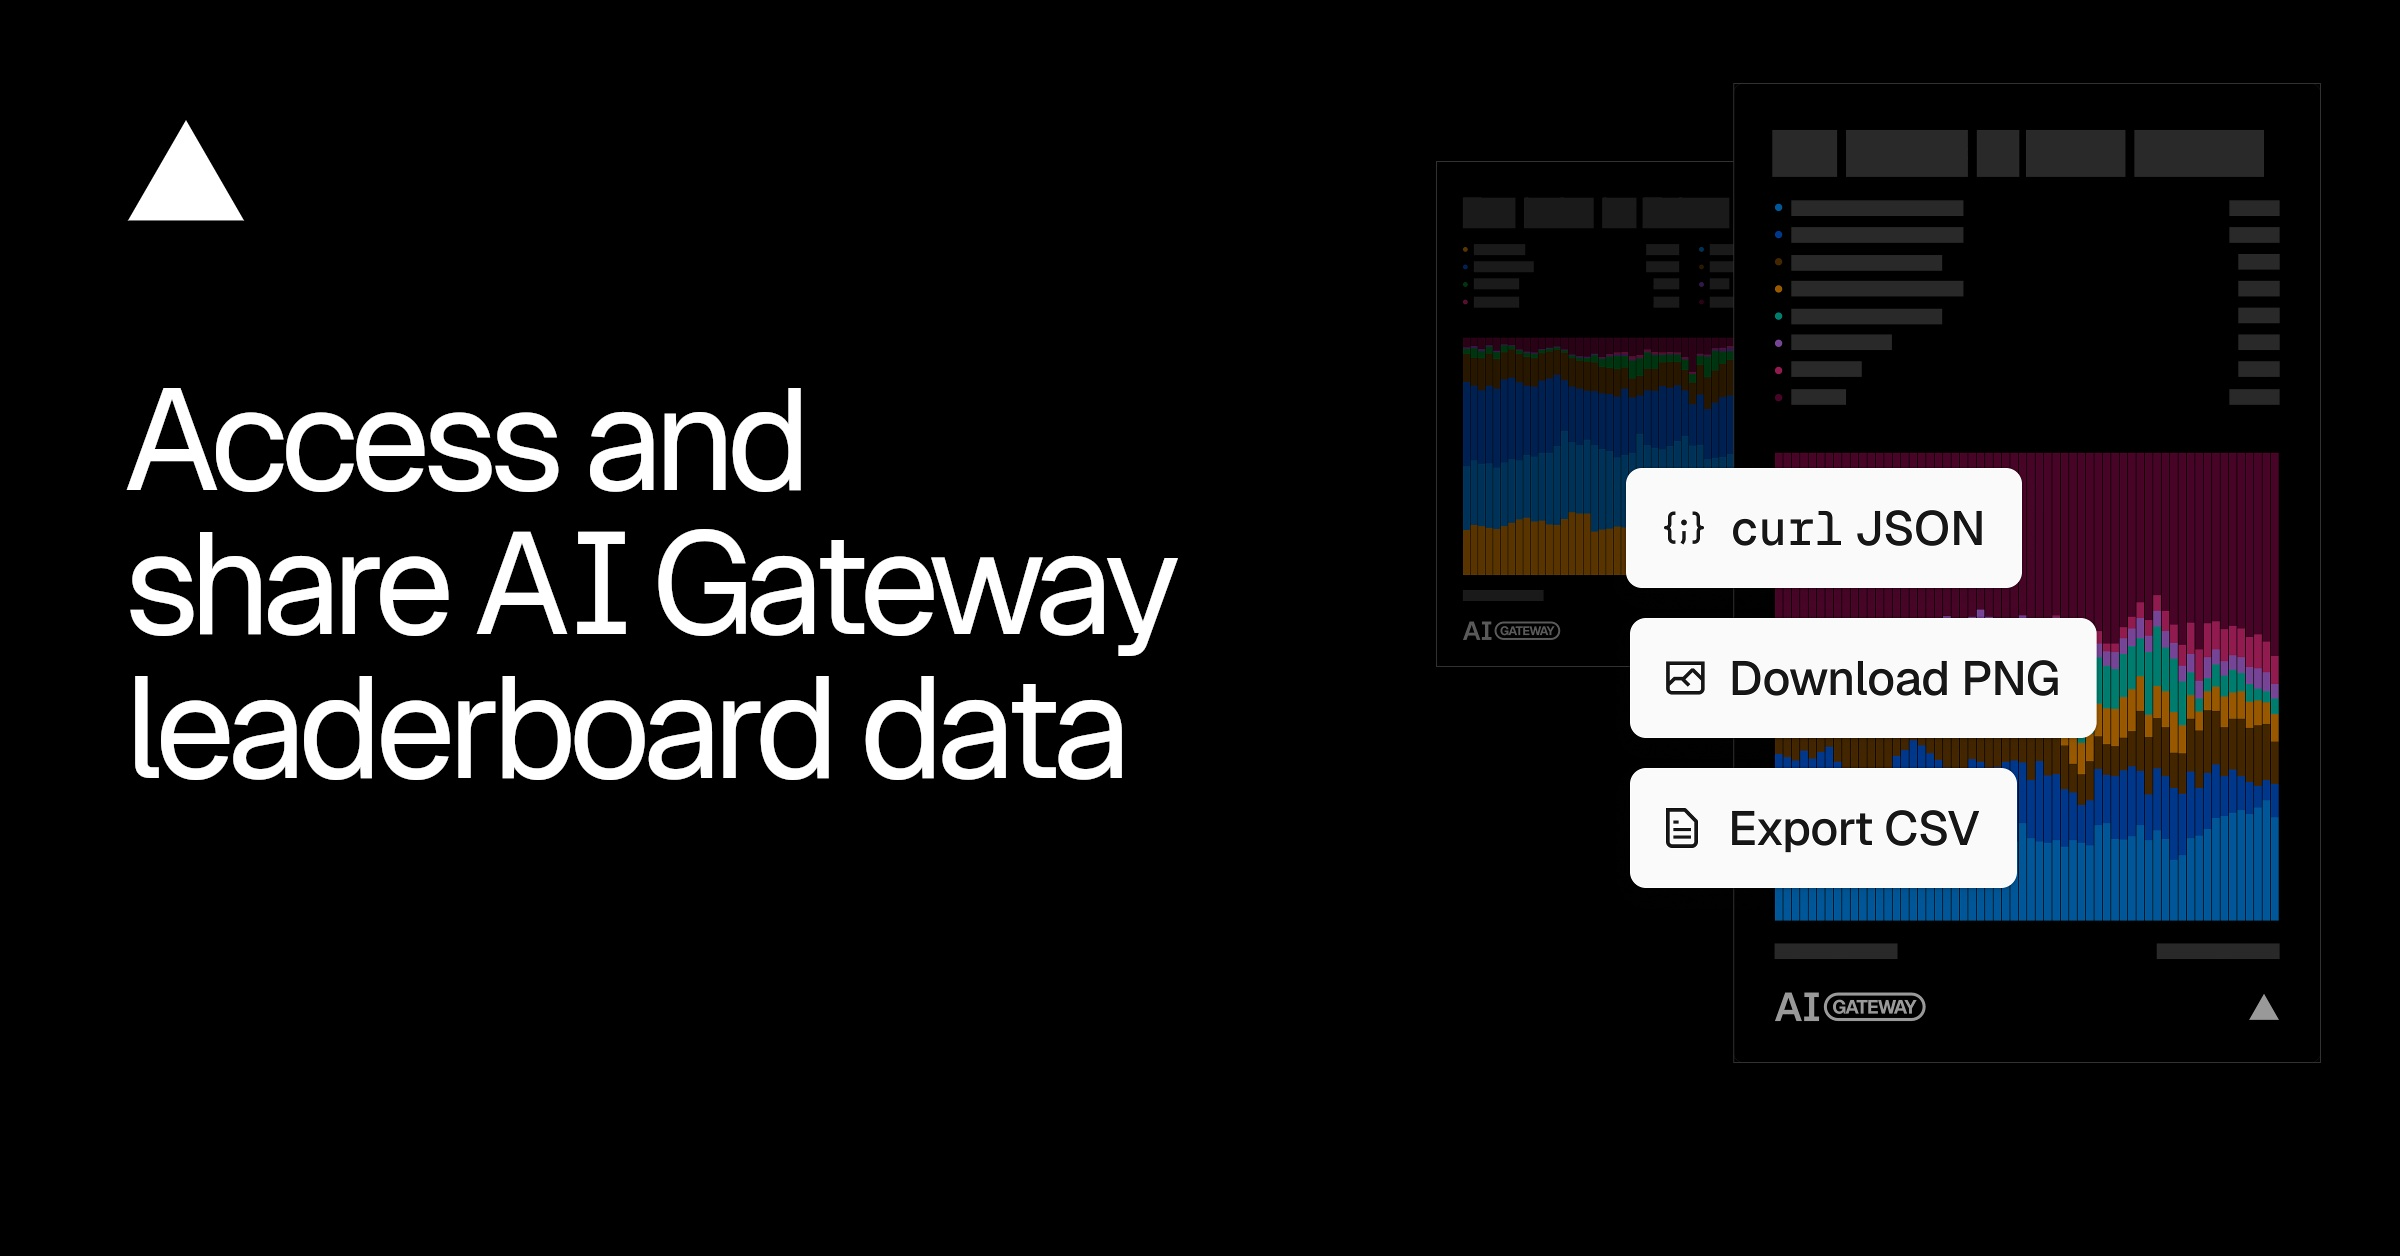
We are making the data behind the AI Gateway leaderboards open under the CC BY 4.0 license . You can now download or query the data through the leaderboard-export API endpoint and render any chart as a shareable image.
The AI Gateway leaderboards show how AI is used in production, ranking traffic for models, labs, apps, and providers. Data is aggregated daily across trillions of tokens, so you can see what gets adopted and how that changes over time. For deeper analysis, see the July AI Gateway Production Index .
Copy link to heading What's ranked
There are four leaderboards, each with its own metrics:
The four leaderboards and the metrics each one ranks.
Models and labs can be filtered by modality (text, image, video) and show a daily percentage share over time; apps and providers are aggregated across all modalities and show a ranked top list.
Copy link to heading Open data
The data behind the leaderboards is open, published under Creative Commons Attribution 4.0 (CC BY 4.0) .…