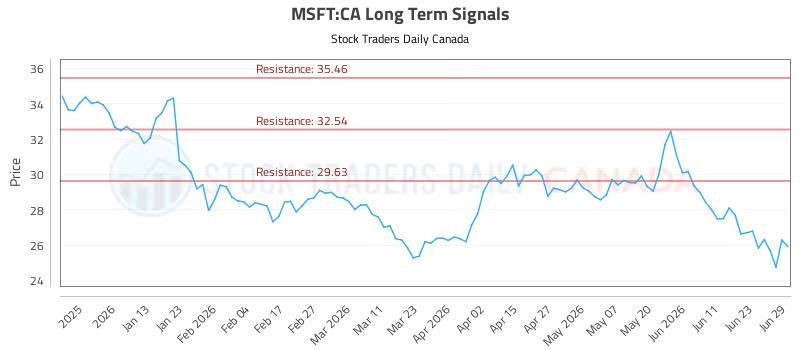
Proprietary Signals for MSFT:CA
Chart for Microsoft CDR (CAD Hedged) ( MSFT:CA )
Blue = Current Price
Red = Resistance
Green = Support
Trading Plans Summary
Side-by-Side Comparison
Trading Plan Bias Action / Trigger Profit Target Stop Loss Execution Rule
Risk Hedging Strategy
Tactical / Swing SHORT / HEDGE $29.63 N/A $29.78 (+0.51%) Enter short near the entry level; cover at the target; stop loss if resistance breaks.
Tactical / Swing Reward/Risk —
Step 1 · Enter Sell short near $29.63
Step 2 · Take profit Buy back (cover) at N/A
Step 3 · Protect Exit if price rises above $29.78 +0.51%
Plan Short MSFT:CA near $29.63 · Target N/A · Stop $29.78
Order Level Price Distance from Trigger
Stop Loss (exit if above) $29.78 +0.51%
Trigger (short below) $29.63 —
Target (cover at) N/A —
Objective: Portfolio Downside Hedge Horizon: Tactical / Swing Status: Active Conditional Order Reward/Risk: —
Entry $29.63
Target N/A
Stop Loss $29.78
Multi-Timeframe Signal Analysis NEUTRAL BIAS
TIME HORIZON…