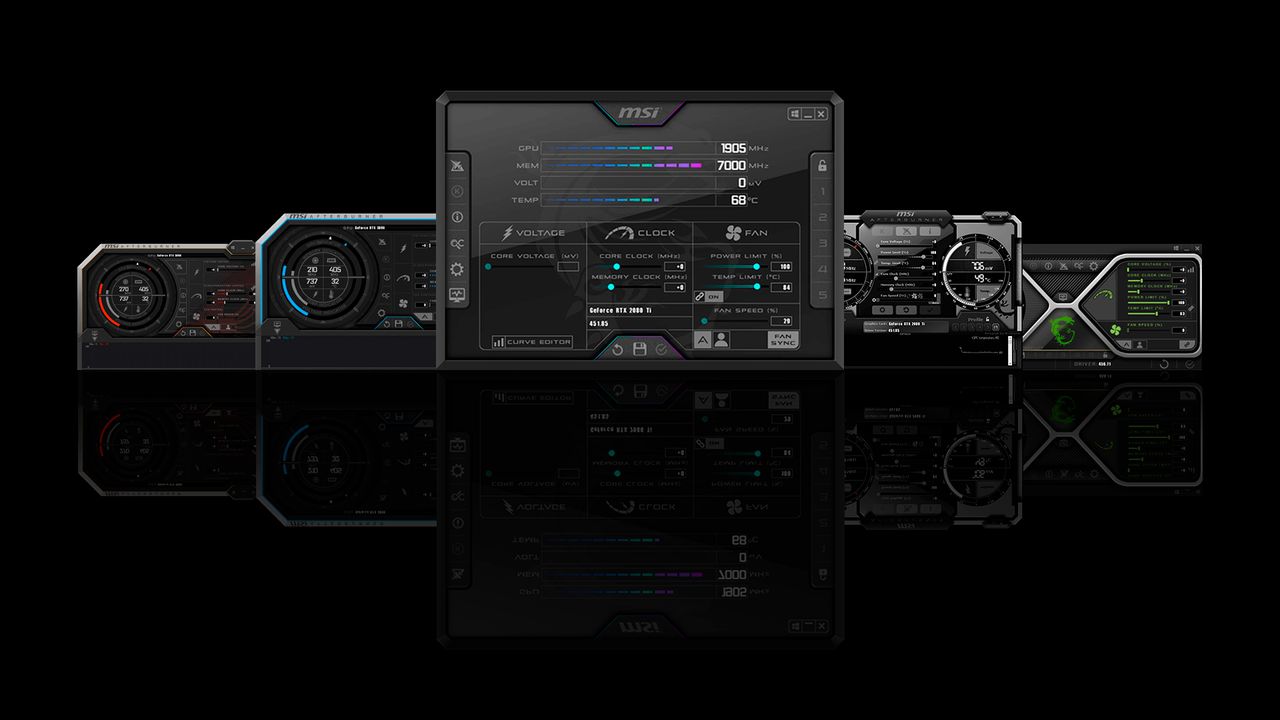
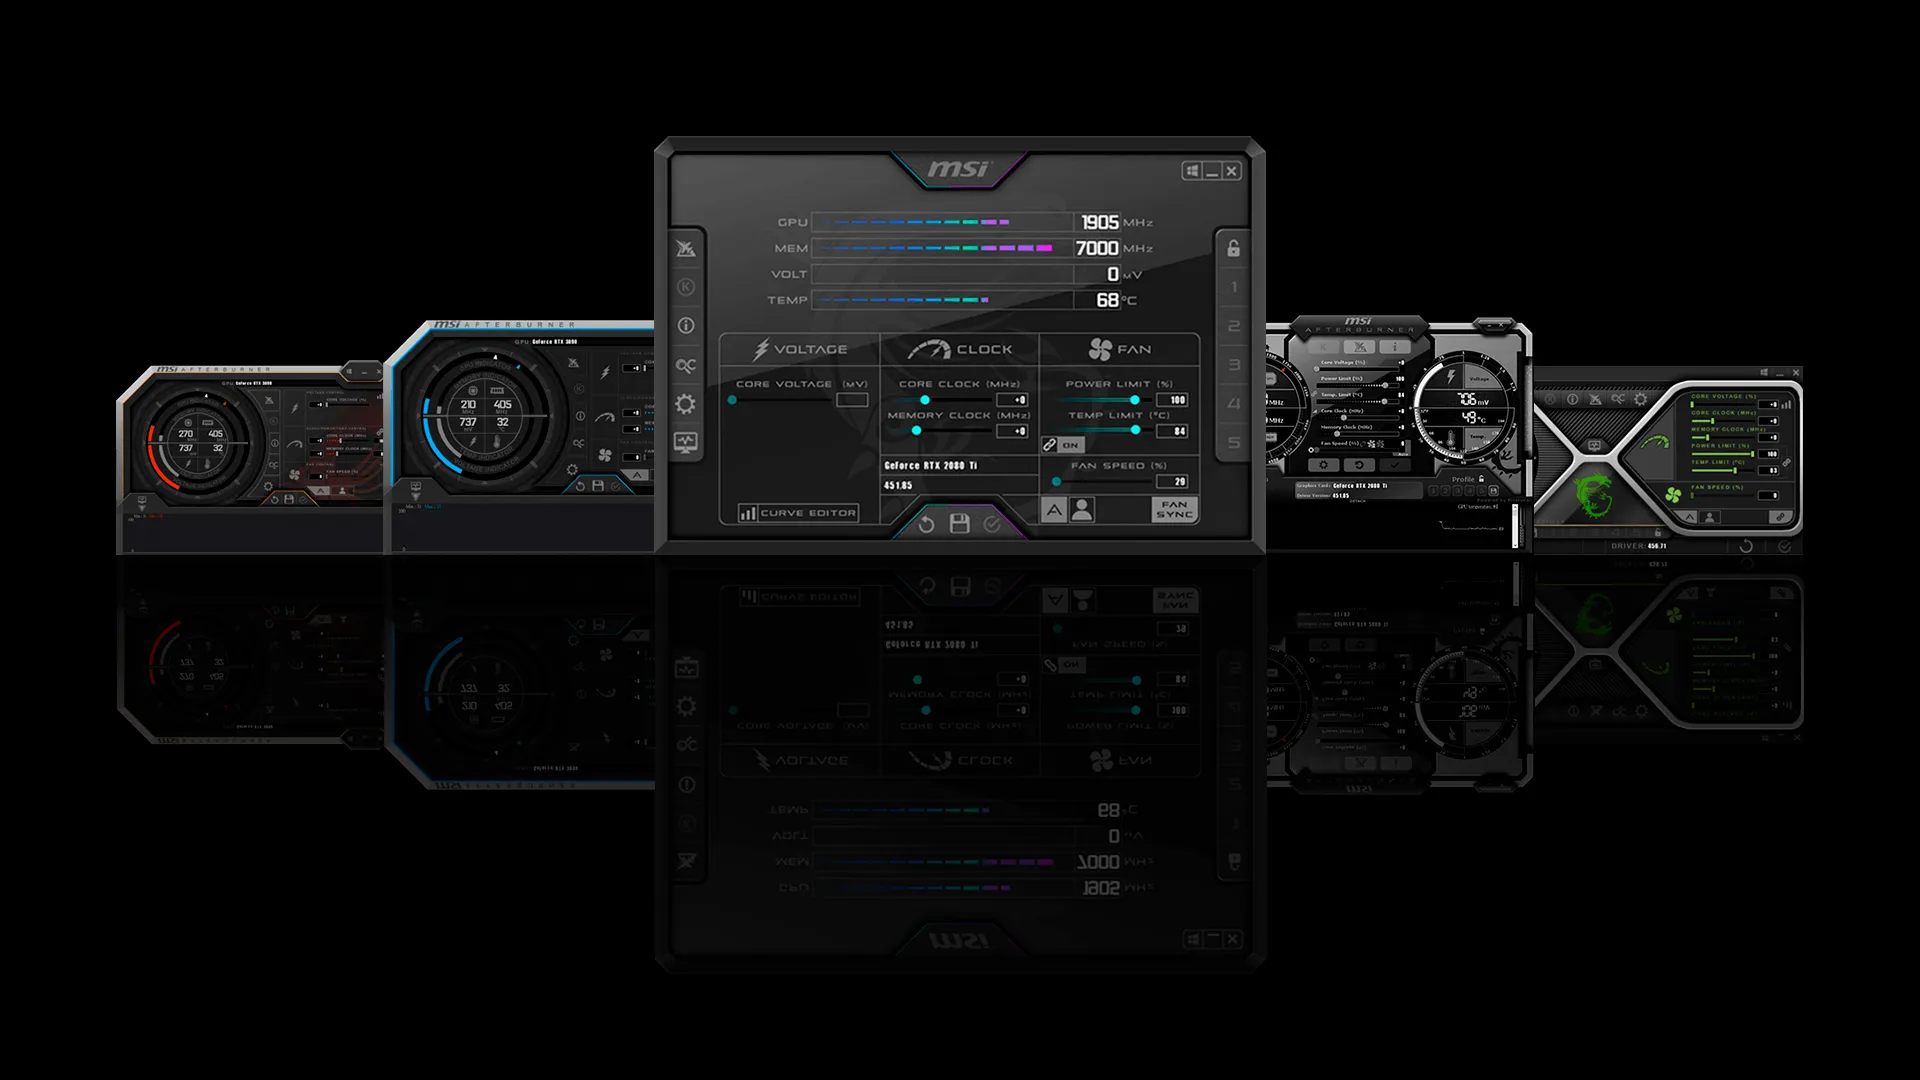
(Image credit: MSI) MSI Afterburner’s solo developer is working on a new update that provides a heatmap of the most-used voltage/frequency points a GPU is operating at within Afterburner’s voltage/frequency curve chart. The update is designed to help enthusiasts and overclockers better understand the boosting behavior of their GPU and adjust their GPU’s overclock accordingly. Unwinder, Afterburner’s developer, reported on the Guru3D forums that this update will be released with 4.6.7 beta4 for users to test. An official (non-beta) release with the heatmap has not been announced yet. The new heatmap generates yellow dots within Afterburner’s existing V/F curve editor, making it easy to compare the GPU’s existing V/F curve against where the GPU is boosting in real workloads. For instance, Unwinder shared a screenshot of the heatmap being used with an RTX 5090, showing the GPU operating primarily at 800mv at 1200MHz, and 1000- 1055 mV at around 2.6 to 2.8GHz.…