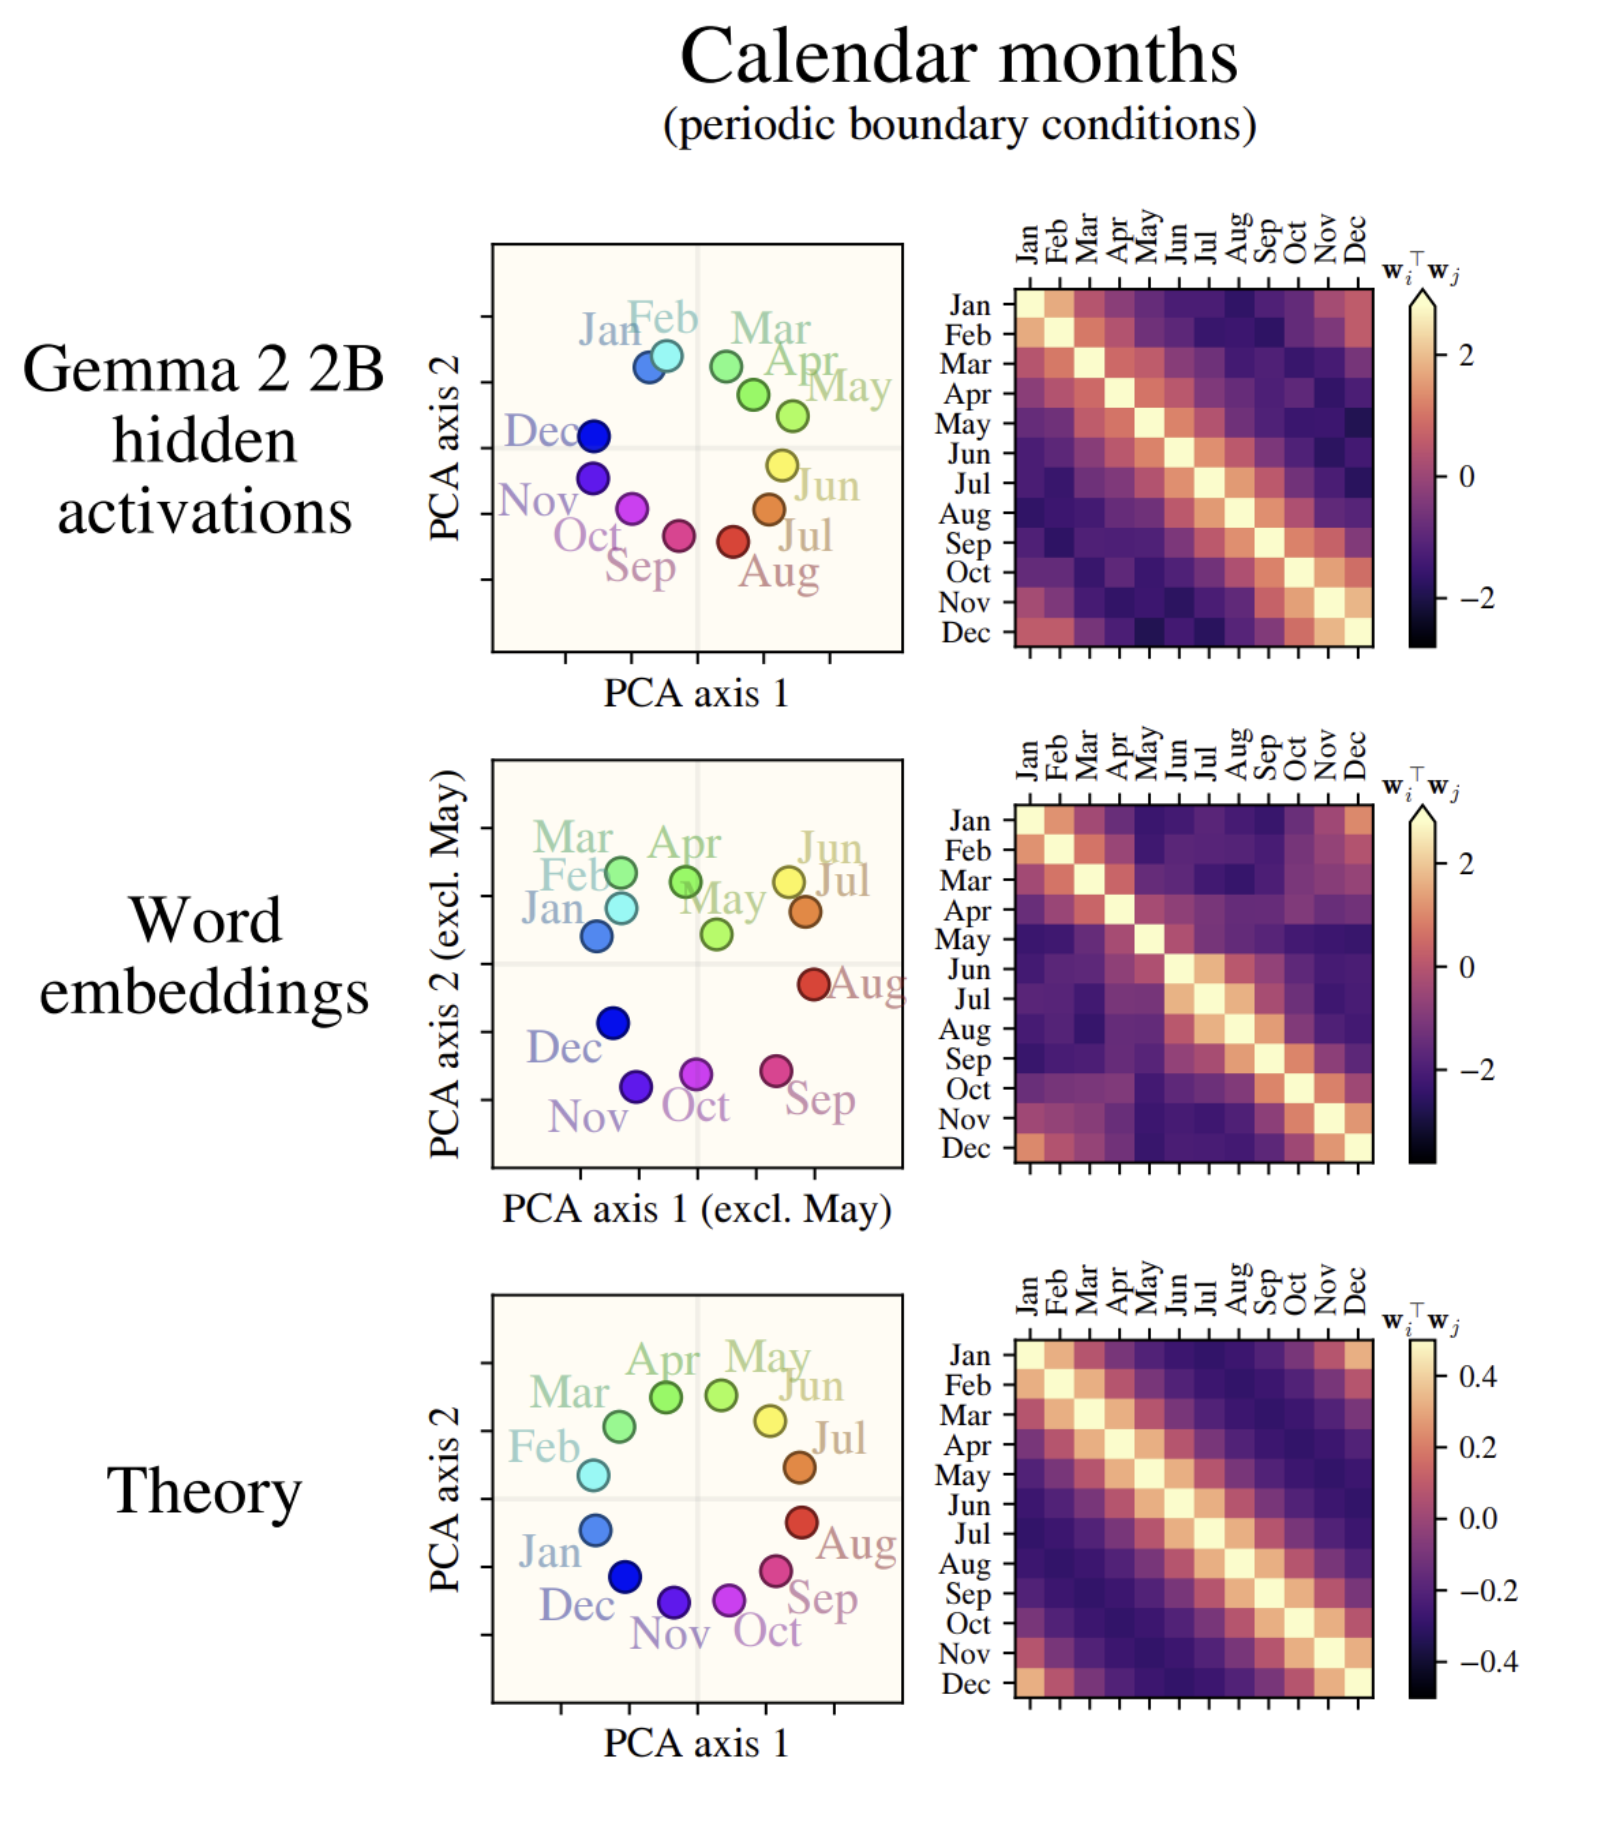
My longtime labmate-turned-student/friend 1 Dhruva Karkada recently wrote a sick paper on data statistics which deservedly went viral on Twitter, in part because it has one of the prettiest scientific figures I have ever seen:
Say you’ve got a bunch of words that live in a vocabulary $\mathcal{V}$. We’re here studying models $f$ that map $f: \mathcal{V} \rightarrow \mathbb{R}^d$: that is, they map every word to a $d$-dimensional vector. We’re letting $\{v_i\}_{i=1}^{12} = \{\texttt{January}, \texttt{February}, \ldots\}$ be the months of the year, taking the 12 associated embedding vectors $\mathbf{w}_i = f(v_i)$, and computing two things:
a projection onto the top two PCA directions of $\{ \mathbf{w}_i \}$ (left column), and
the Gram matrix $\mathbf{M} \in \mathbb{R}^{12 \times 12}$ such that $M_{ij} = \mathbf{w}_i^\top \mathbf{w}_j$ (right column).
Reading the rows of this figure from top to bottom, 2 they find that:
LLM embeddings project down to a circle (as Engels et al (2024) also saw), and the…