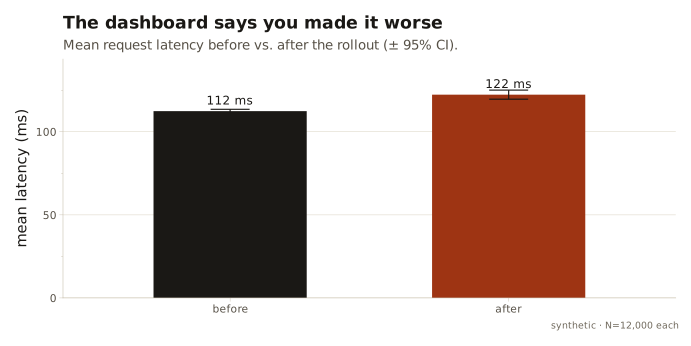
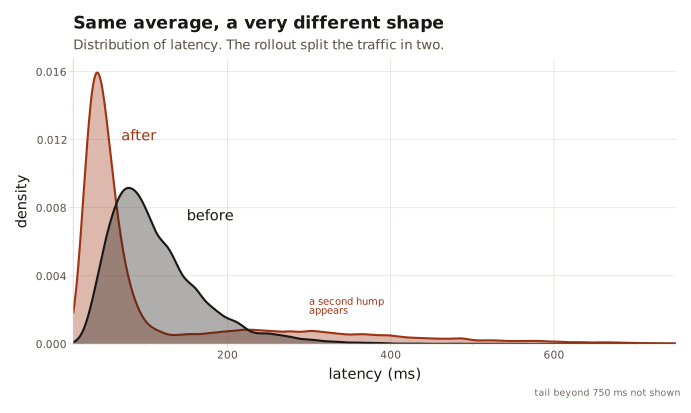
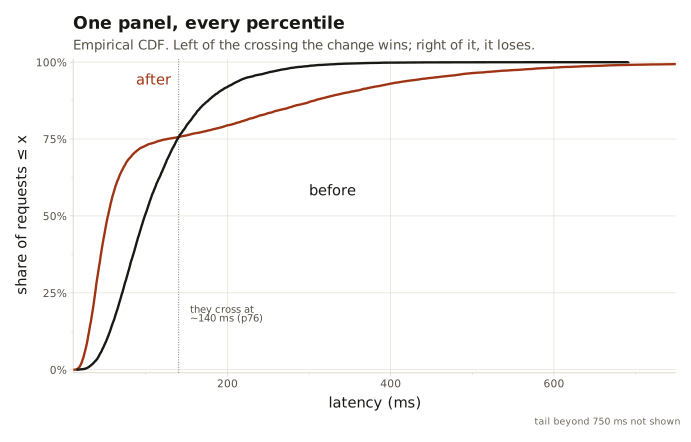
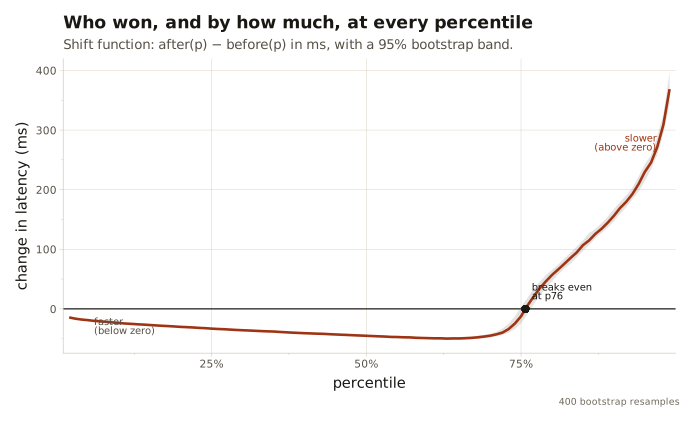
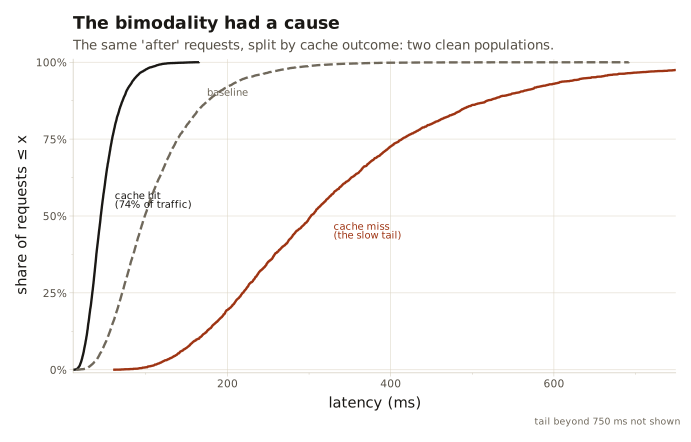
I was recently trying to validate some performance improvements related to lld at $DAYJOB and it was a little frustrating to see the improvements in our benchmarks but not in the live-production dashboards. Having come from a background working on web-services, I was used to looking at individual time-series dashboards, sometimes over a few percentiles, and I was expecing to see some noticeable change but the data seemed too noisy to make any conclusions. Turns out a colleague had also faced similar issues when trying to evaluate build-speed improvements. There are lots of variables that can affect the build: cold-cache, incremental, local, remote, etc. and the build times can vary wildly depending on the state of the system and the workload. She ended up leveraging a cummulative distribution function (CDF) to visualize the data and it was a revelation to me.…